We offer innovative and efficient GIS solutions through data analysis and visualization; our team specializes in Data Science extracts value from the databases to develop dashboards through Power BI that help our costumers improve the decission making process and increase their knowledge about the areas they want.
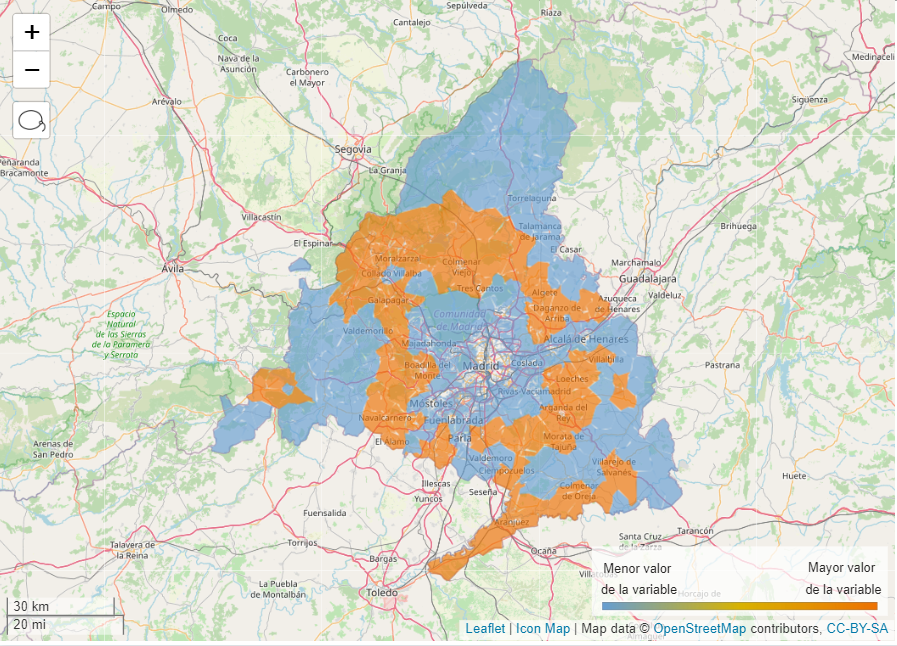
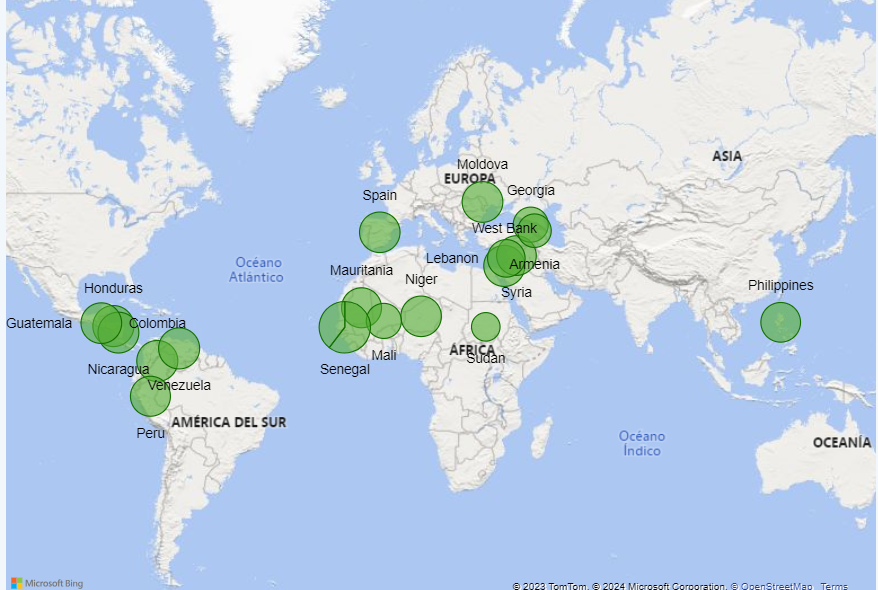
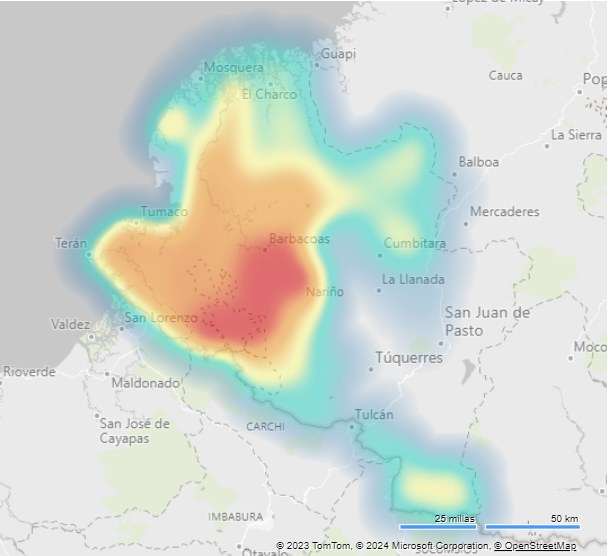
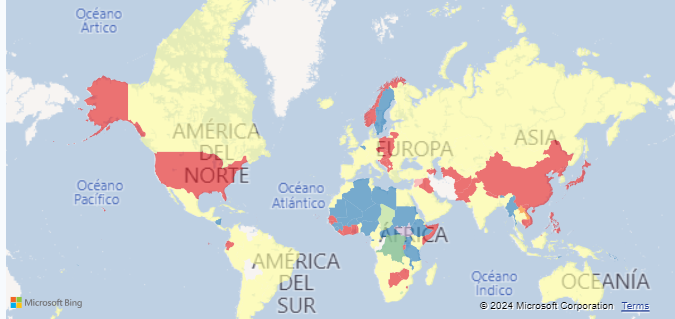
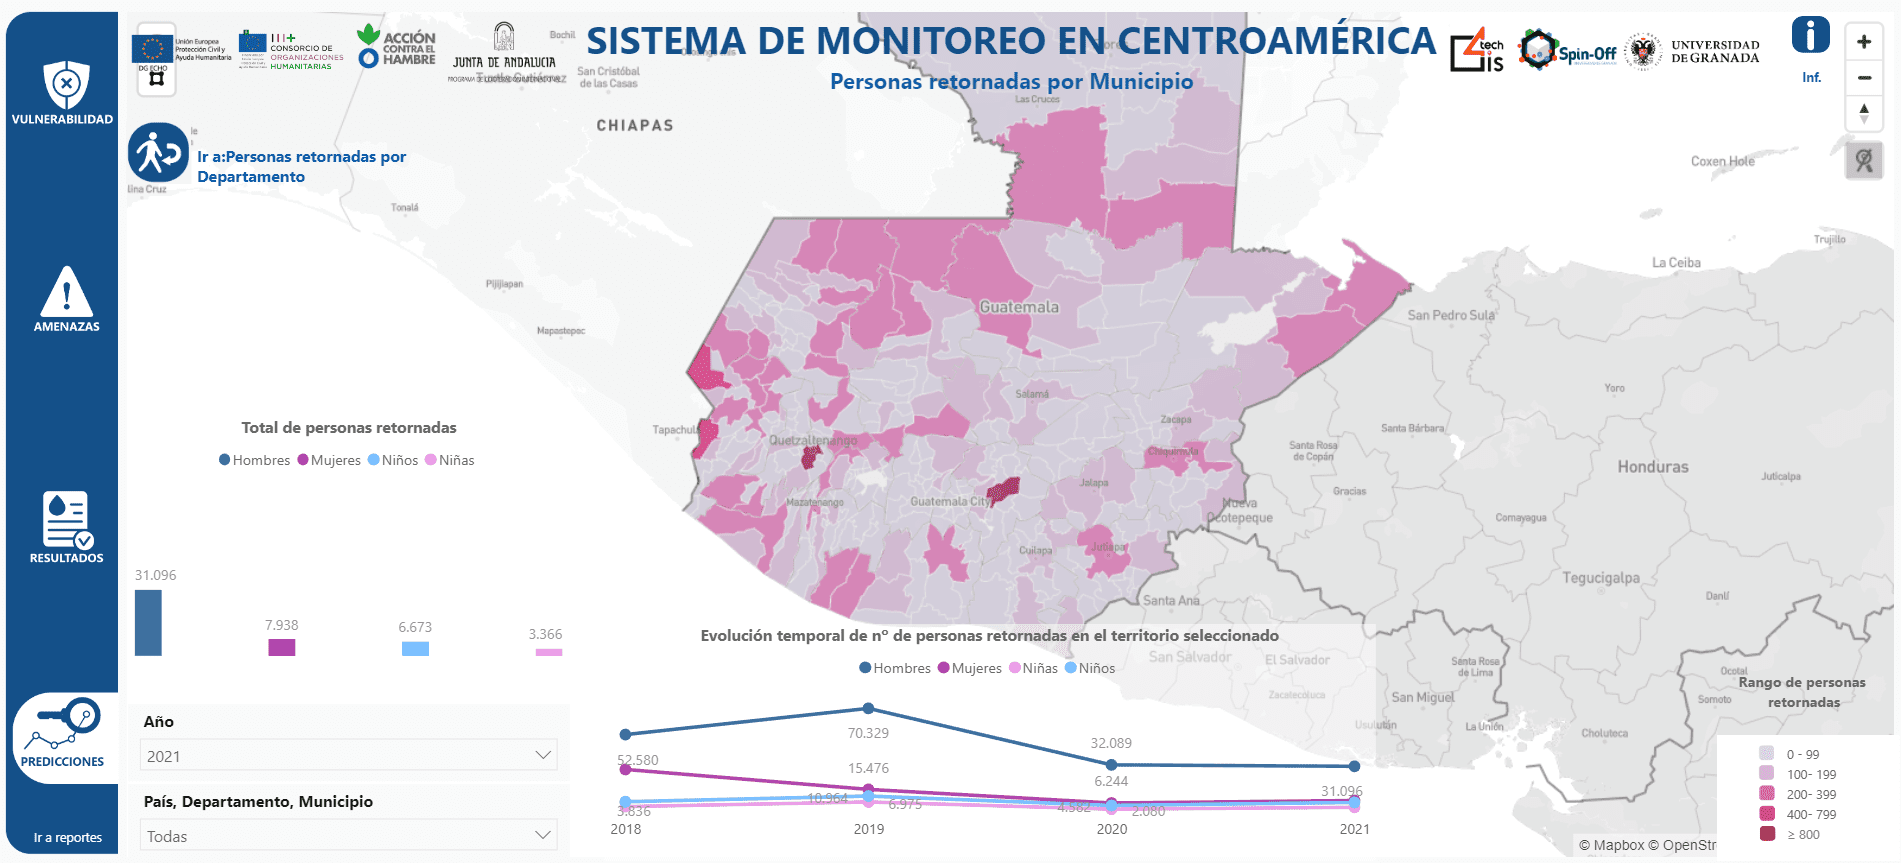
When dealing with projects that require the analysis and visualization of information we employ several data collection techniques: download of satellite information (NASA or ESA ), obtaining databases from public agencies, field surveys or data collection from social networks. Subsequently, in order to convert meaningless individual data into valuable information, we carry out a process of standardization, decoding, error correction and georeferencing of the data using Geographic Information Systems (GIS) to create Data Warehouses. Finally, we dump all the processed information to interactive dashboards in Power BI format and we generate custom-made displays with real time data and being constantly updated. Therefore, this process of Data Mining allows our costumers to take advantage of the information, that evolves from being disaggregated and unconnected to being structured, understandable and useful for their goals trough the pattern obtention and prediction generation.
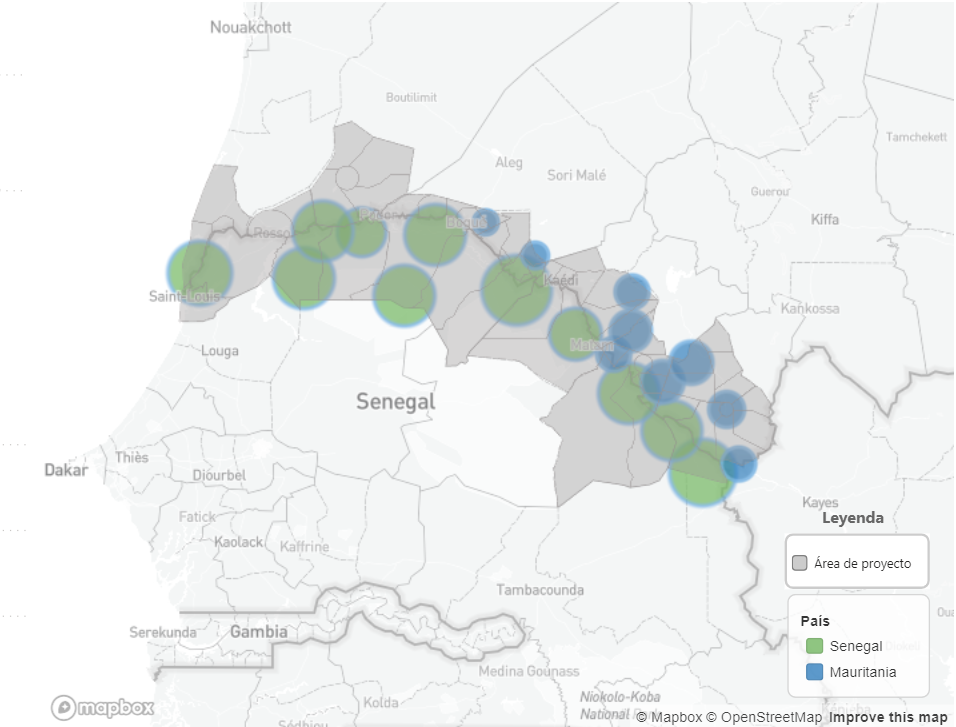
In GIS4tech we apply techniques of Data Analysis to multiple projects and sectors, such as Location Intelligence, Smart Cities or Humanitarian, among others, what provide us the experience and the ability to provide solutions to a wide range of prolems of the geographical and sociodemographic fields.