PRIVATE CUSTOMER

GIS Analysis of Drought in the Central American Dry Corridor during 2018

The months of July and August are characterised by a usual decrease in rainfall accumulations in Central America, this phenomenon is known as canícula. In Central America, the canícula usually occurs from 10 to 20 July and from 5 to 15 August. However, in 2018 the canícula began in the last week of June, continued in July, and lasted until the first half of August, especially in the eastern region and the central plateau. This situation affects Central American countries, including Guatemala, Honduras and Nicaragua, and their communities with varying degrees of intensity.

Consequently The overall objective of the consultancy is to identify the Central American municipalities where a higher rainfall deficit during the first planting of staple grains in 2018 overlaps with a higher incidence of poverty, migration, chronic malnutrition and food insecurity to assist decision-making.

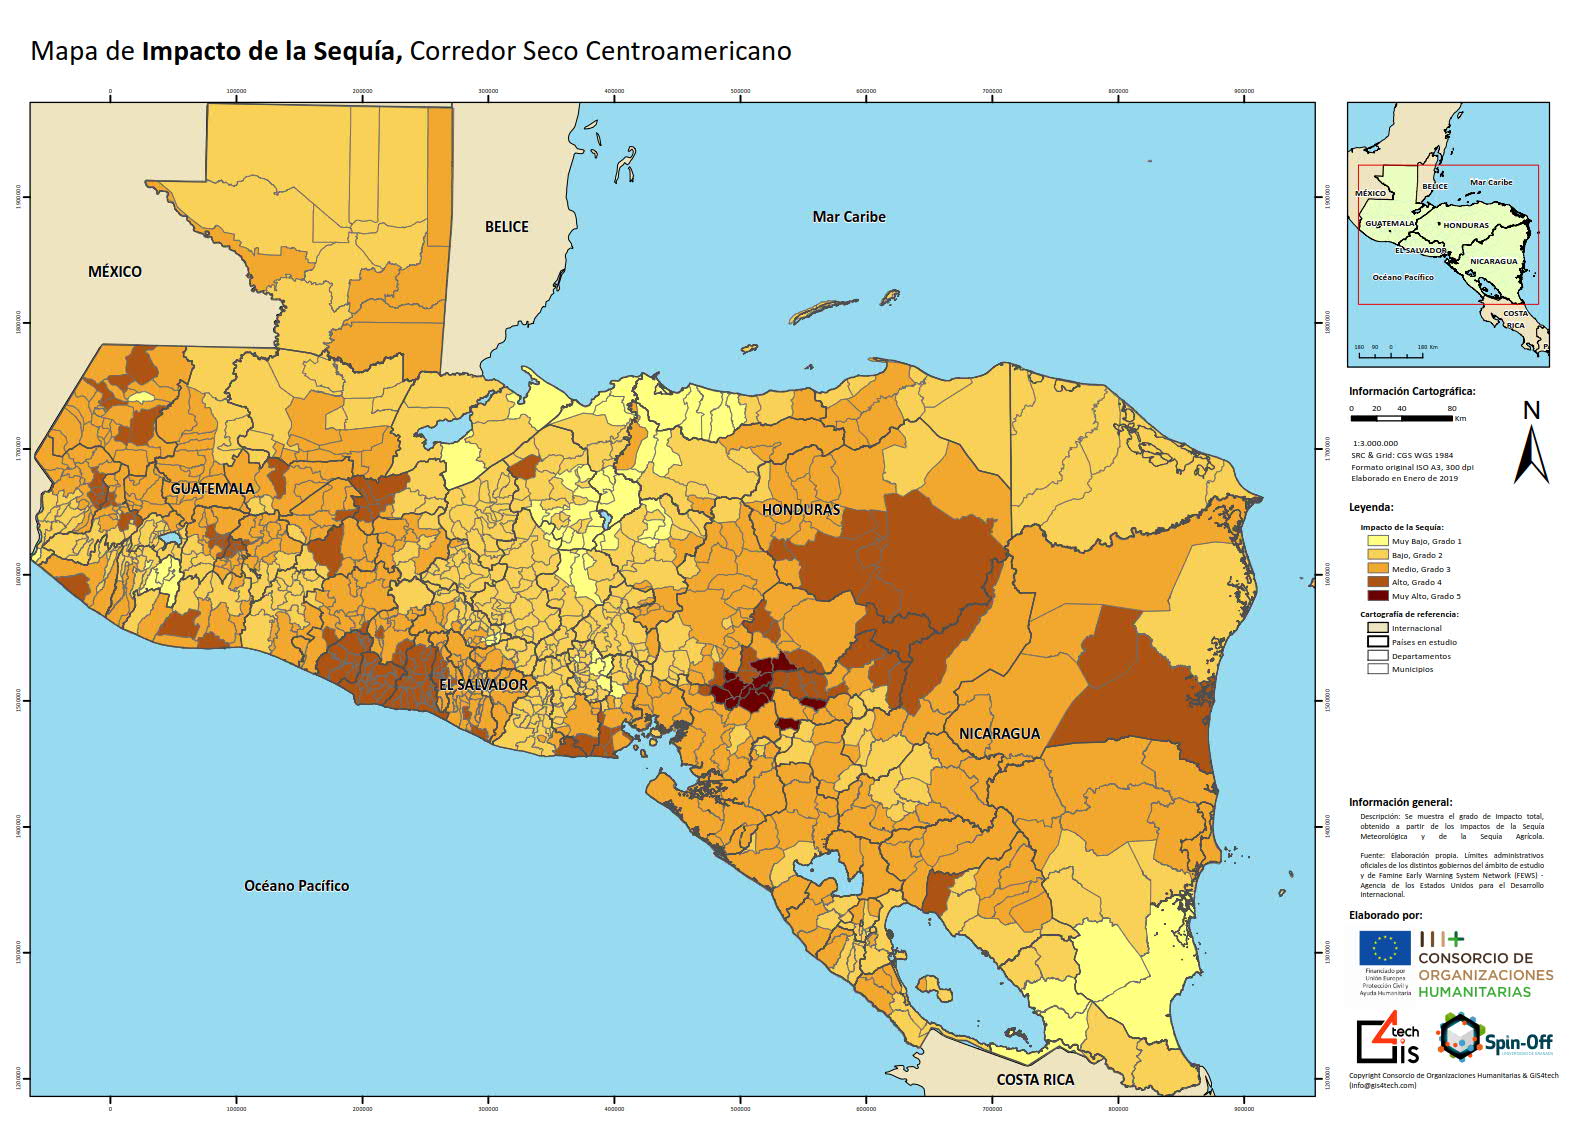
Drought impact map of the Central American Dry Corridor

For this purpose, agro-climatic and vegetation status information was obtained in Nicaragua, Guatemala, El Salvador and Honduras, analyses and maps of precipitation deficits and vegetation status in the four Central American countries mentioned above were produced during the rainy season (May-August), municipal information on poverty, food insecurity and/or chronic malnutrition was collected, and GIS analyses were carried out to cross-reference information on the impact of the drought in 2018 and the incidence of poverty, migration, chronic malnutrition and food insecurity, all reflected in thematic mappings, some of these are shown below.

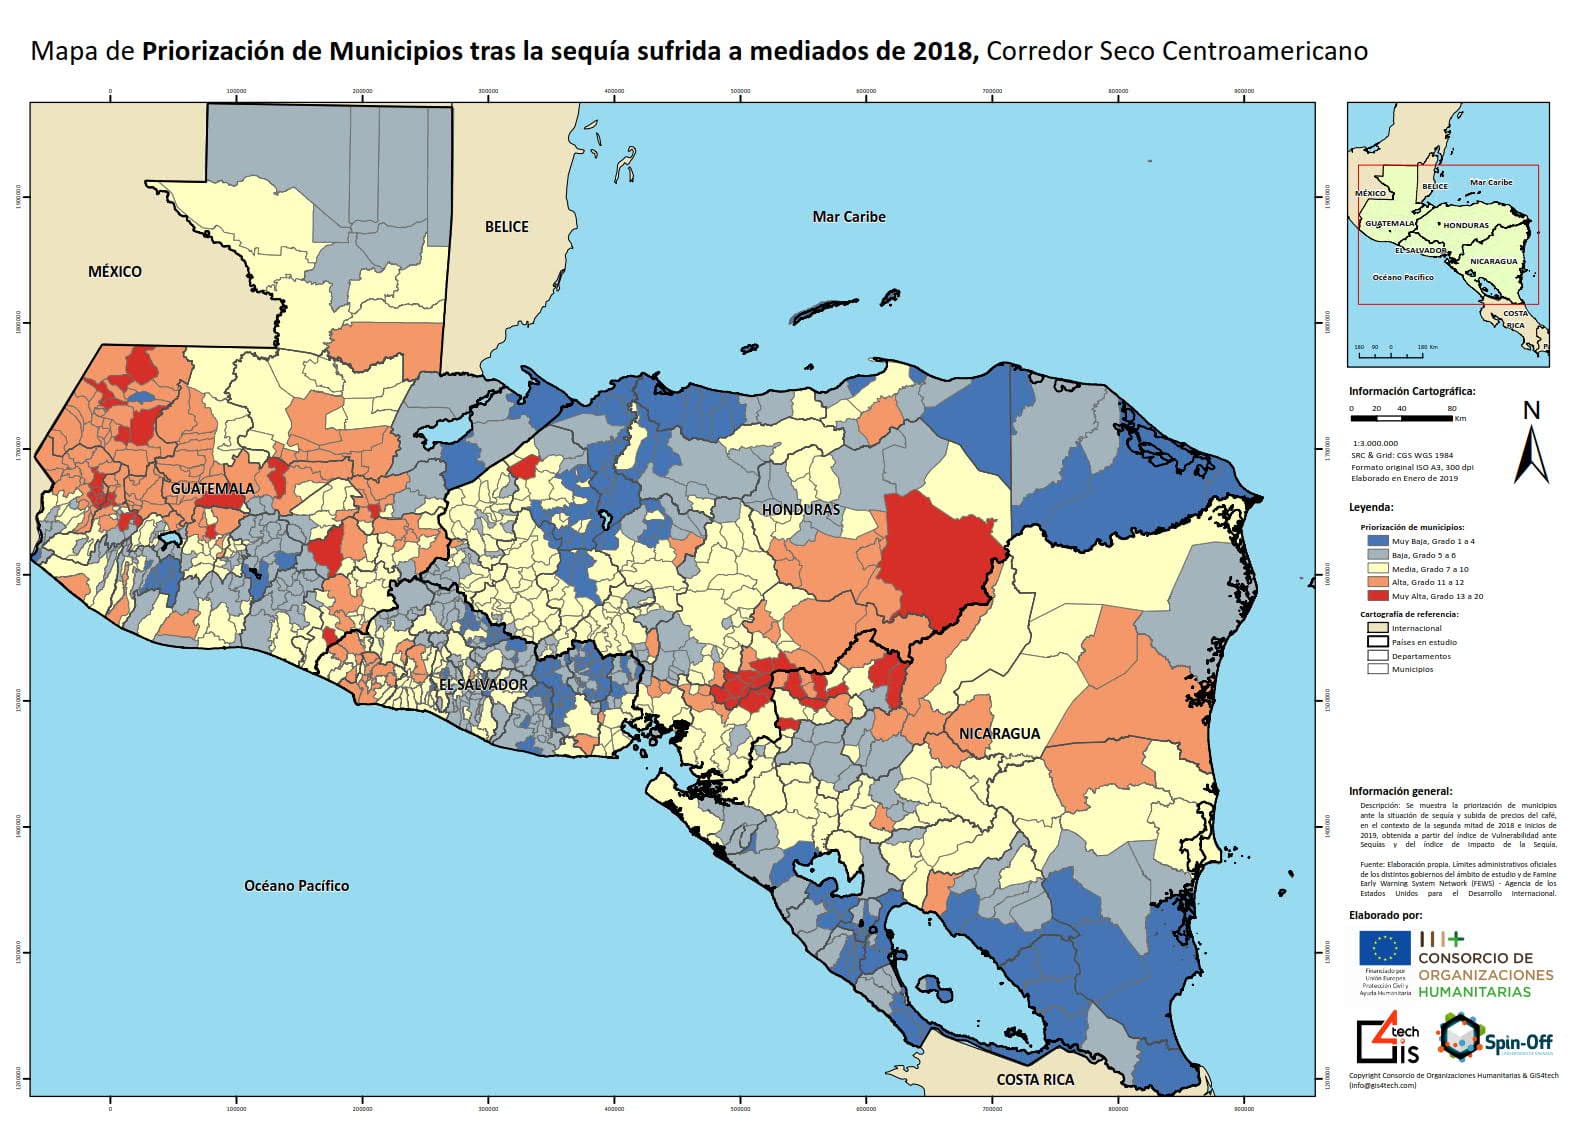
Map of prioritisation of municipalities after the drought in mid-2018 in the Central American Dry Corridor

Specifically, these were the activities carried out:

  • Detailed agro-climatic and livelihoods information search for Nicaragua, Guatemala, El Salvador and Honduras, with special emphasis on rainfall data for the 2018 rainy season.
  • Elaboration of thematic maps of precipitation deficit and vegetation status for Honduras and El Salvador during the 2018 rainy season, with emphasis on the department of Madriz.
  • Searching, identifying and obtaining databases from the governments of Honduras, Guatemala, Nicaragua and El Salvador, international organisations and development banks, with information disaggregated by municipality in relation to poverty, chronic malnutrition, food insecurity; migrants and/or migrants detained and deported from the US; economic remittances received and coverage of basic services.
  • Preparation of GIS analyses and maps of drought incidence and of the variables mentioned in the previous point on which information has been collected.
  • Identification of municipalities where a priori the drought in Central America in 2018 may have had a greater impact on food and nutrition.

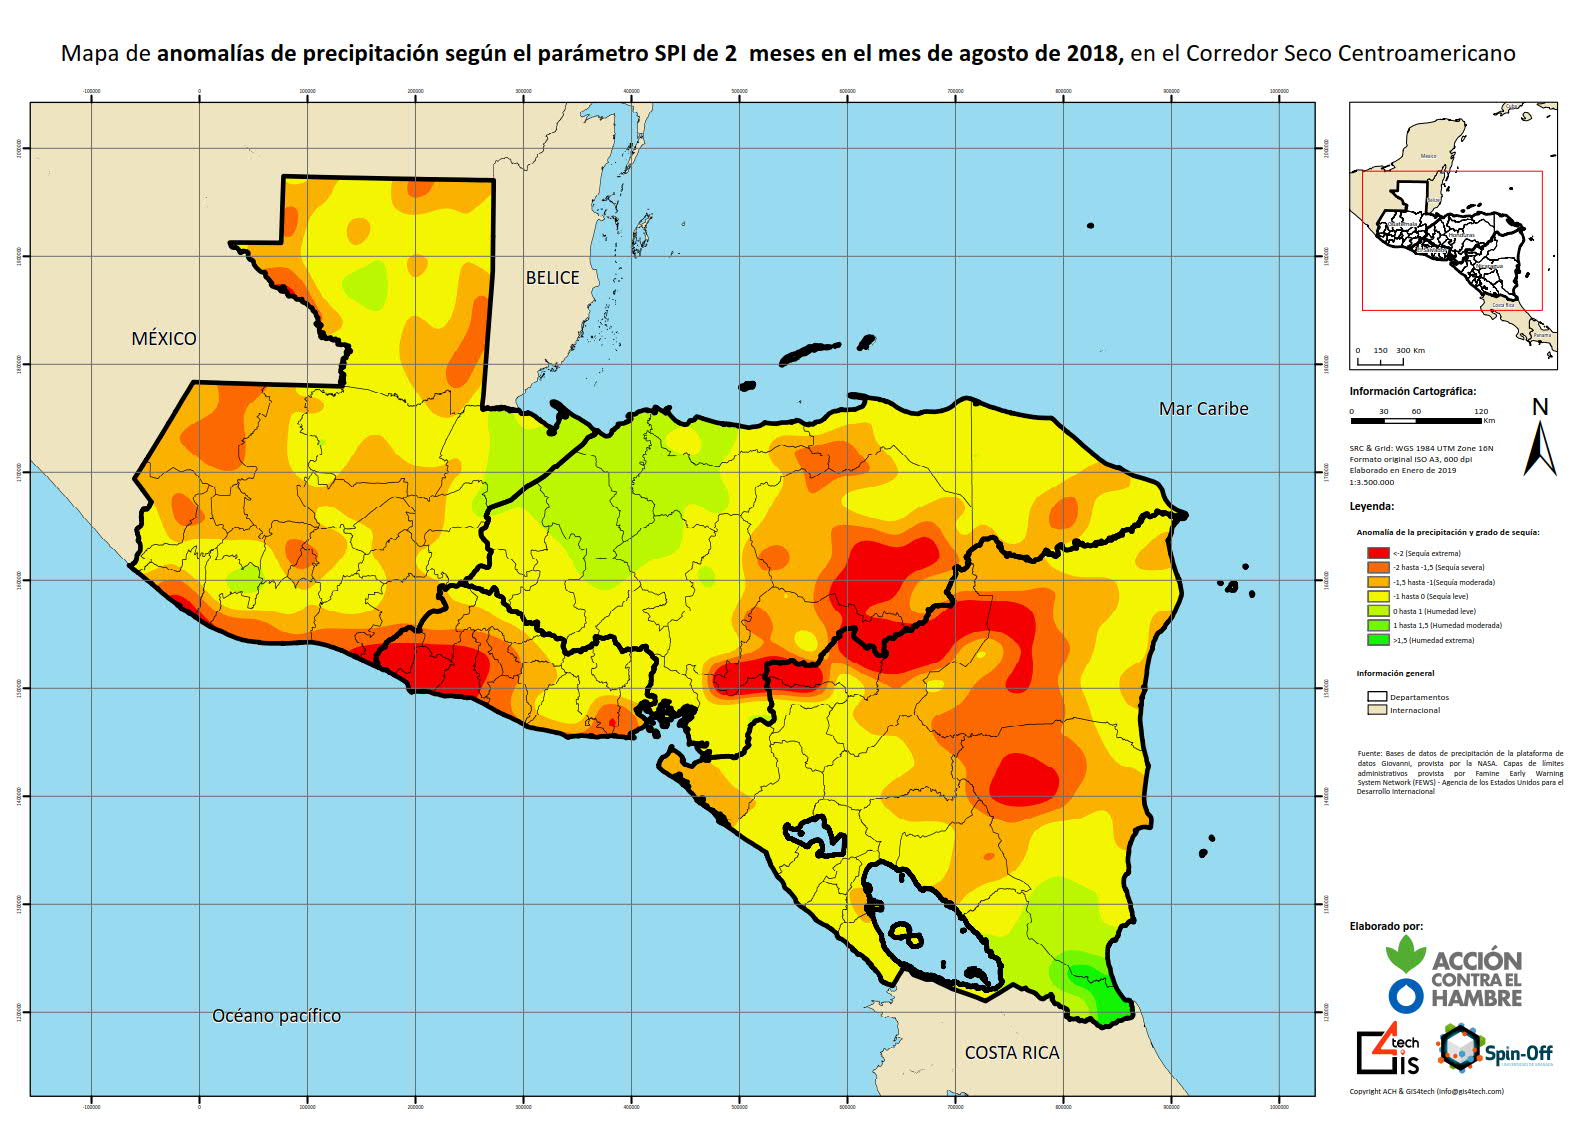
Precipitation anomaly map (SPI) for 2 months in August 2018 in the Central American Dry Corridor

To develop all of the above it has been necessary to apply a methodology to obtain data for the prioritisation of actions in municipalities by NGOs, taking into account variables that are then reflected in the maps mentioned above, such as drought impact (SPI, NDVI) and vulnerability to droughts (livelihoods, food insecurity, poverty, chronic malnutrition and migration), assigning them vulnerability levels from 1 to 5, with 1 being the lowest and 5 the highest, and comparing drought impact with drought vulnerability, it is possible to establish a prioritisation in the various municipalities of the Central American Dry Corridor.

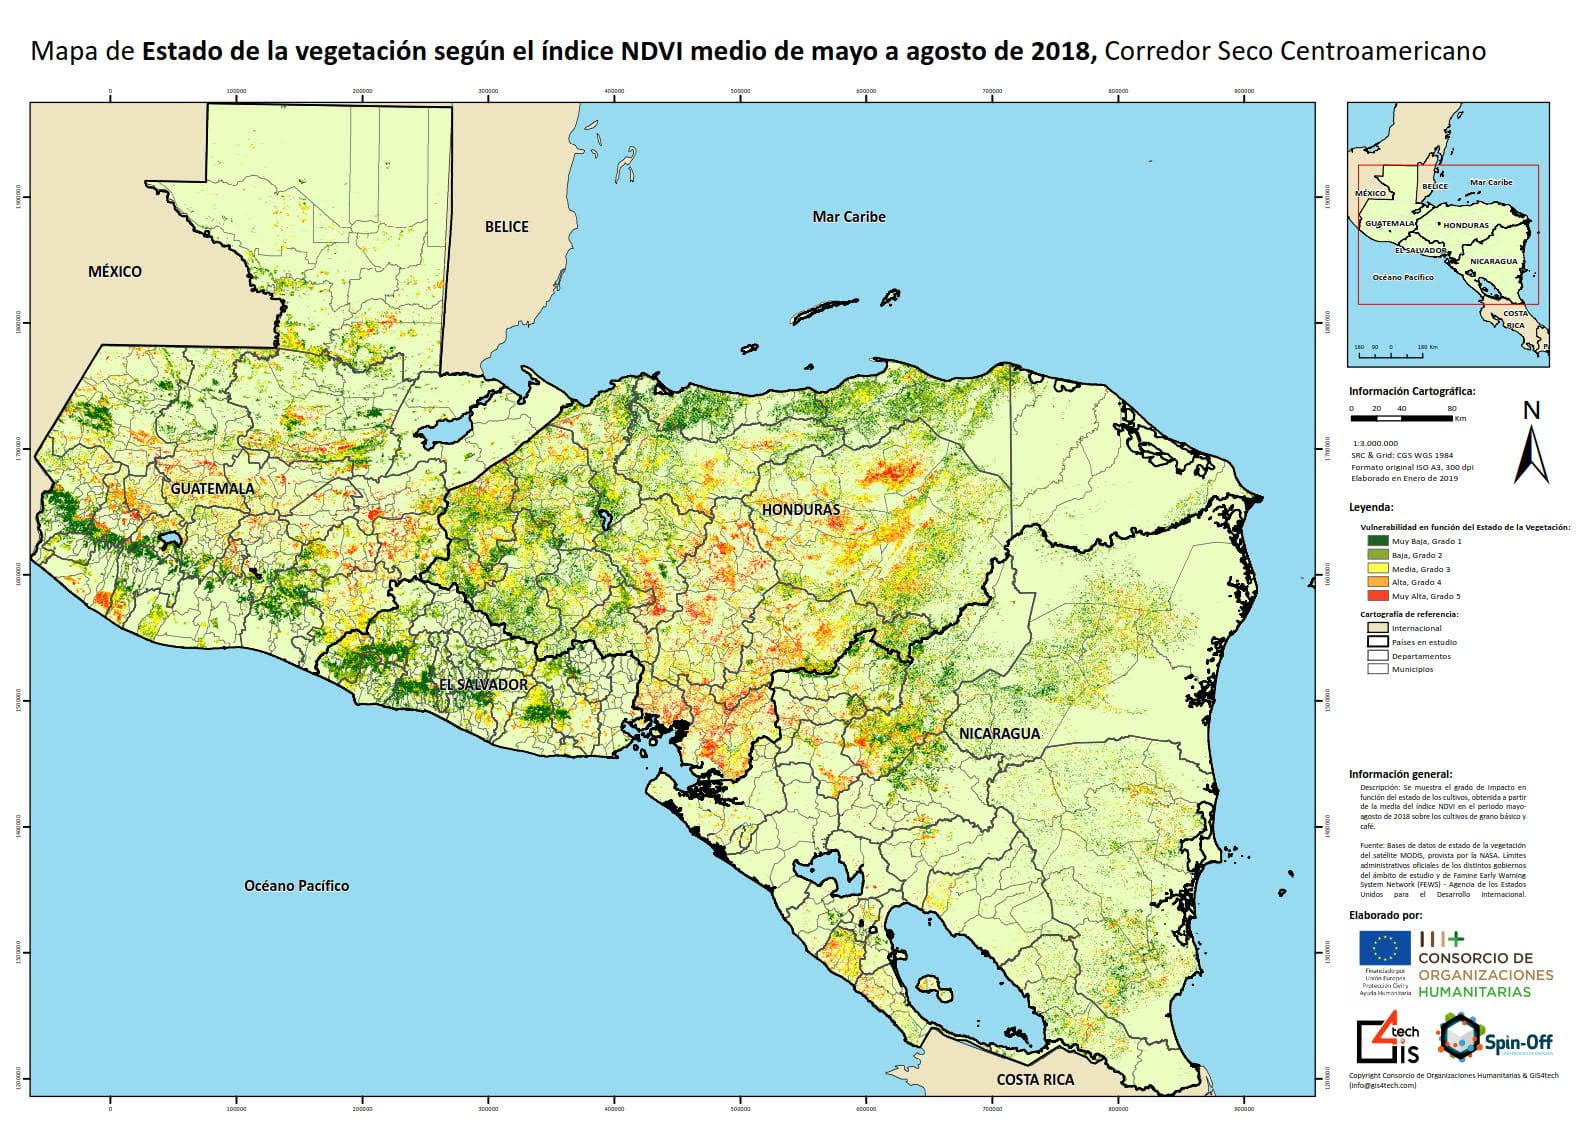
Average vegetation condition map (NDVI) May to August 2018 in the Central American Dry Corridor

error: Content is protected !!