How to detect and monitor floods?

Floods in Central America and Venezuela caused by extreme events such as rains, hurricanes or tropical storms have severe consequences for rural areas and the communities living in themWe, as regular partners in the humanitarian sector, are developing an application to detect and monitor floods in real time and rank them according to their severity to help NGOs to provide more effective emergency responses. INUNDia.

The results of the methodology we follow to detect and monitor floods are reflected in a viewer within our platform. PREDISAN.

Captura de pantalla de la plataforma Power BI en la que aparece la aplicación INUNDia para detectar y monitorear inundaciones

What is flood detection and monitoring?

Within this viewer the different flood warnings can be located in a general way and each affected area can be observed in detailThe alerts are differentiated according to the degree of affection (Damaged / on alert) or the elements of the territory (housing, crops, or infrastructures).

Advantages

Other warning systems provide approximate data on the location of extreme events, as well as the damage caused, which are based on more or less accurate estimates. However, with this viewer we can determine when an event has occurred, where it has occurred and how it has affected the territory and population with a high temporal and spatial resolution.

As the information we obtain is very precise in space and time, it serves as a basis for making decisions regarding specific humanitarian actions.

Steps to calculate the effects of flooding

1. Detection of flood events

Through news and reports obtained from social networks the position of any location in the territory where flooding may be occurring is detected.
Visor de inundaciones que muestra y monitorea el estado de personas e infraestructuras tras una inundación

1. Data filtering and processing

Massive download of satellite images is carried out Sentinel 1 for each zone where the alert exists, and a number of filtering and processing methods are applied for the obtention of the needed product.

Captura de pantalla Copernicus, base de donde sacamos los datos para detectar inundaciones del satélite Sentinel 1

3. Detection of flooded areas

We applied the principal component data analysis technique, based on the comparison with historical Sentinel 1 images. In this way the stain generated by the flooding event can be distinguished from the usual water stains. (riverbeds, lakes...).

4. Flood impact assessment

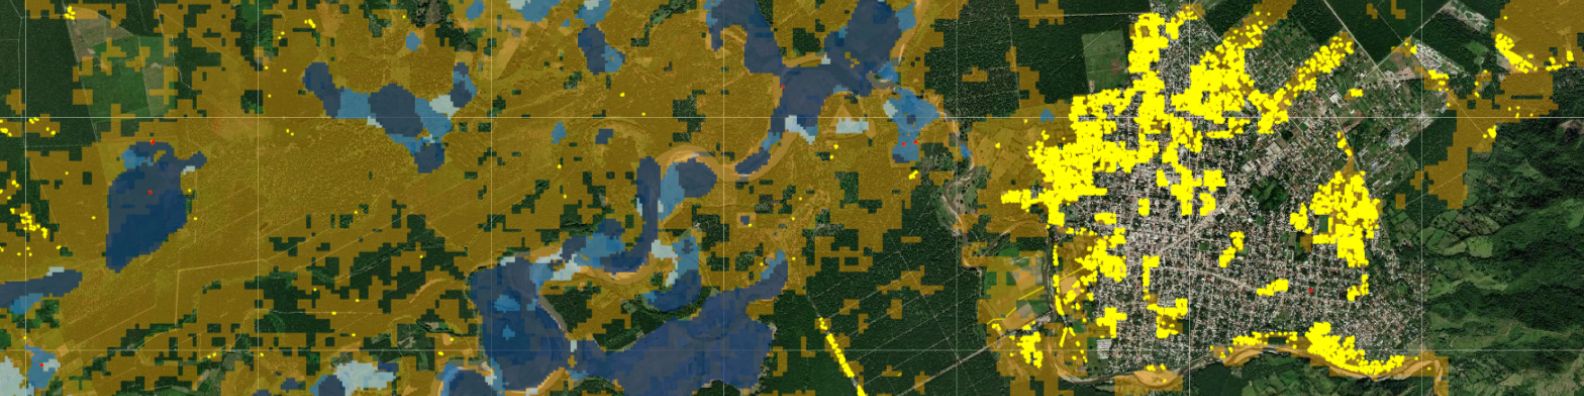
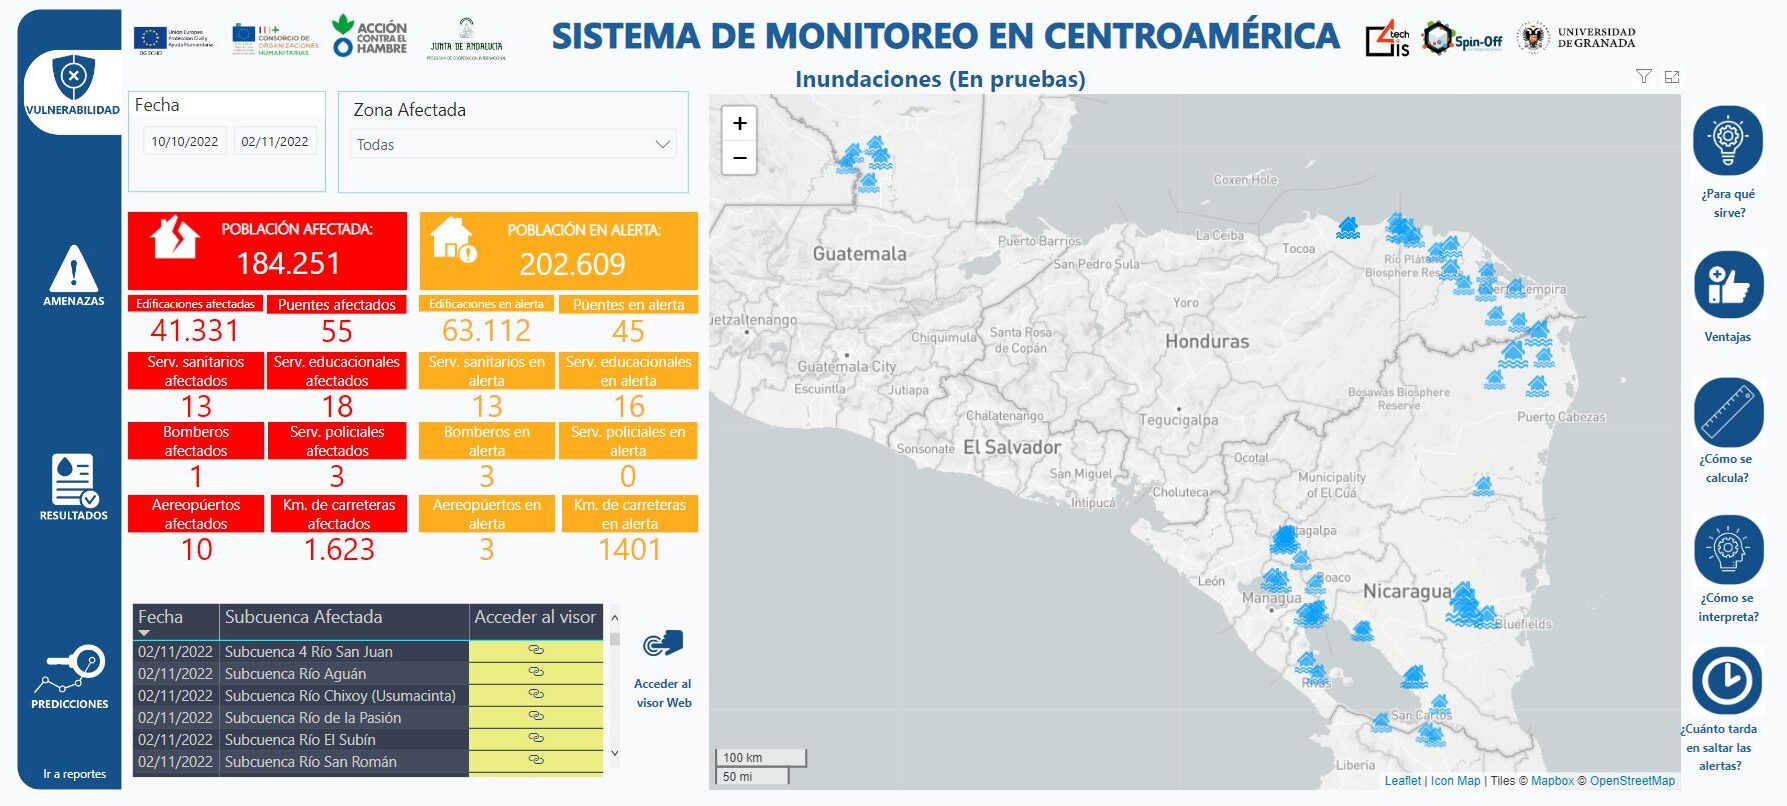
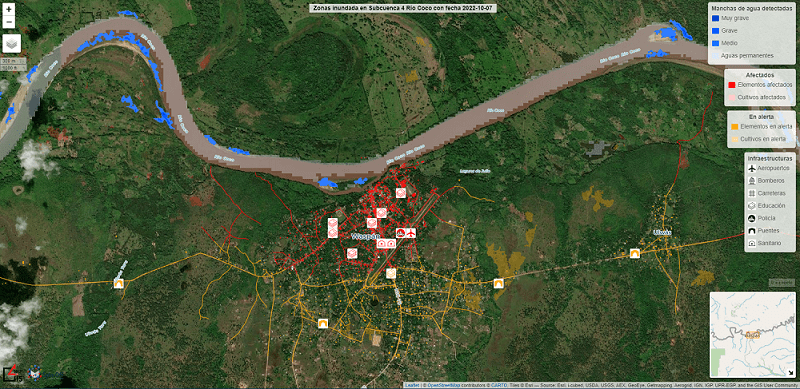
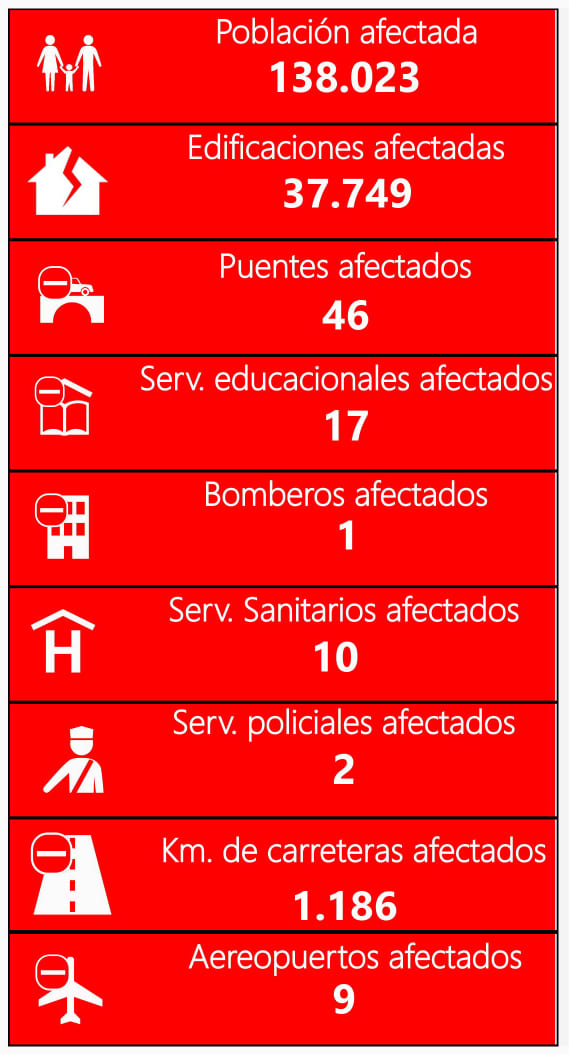
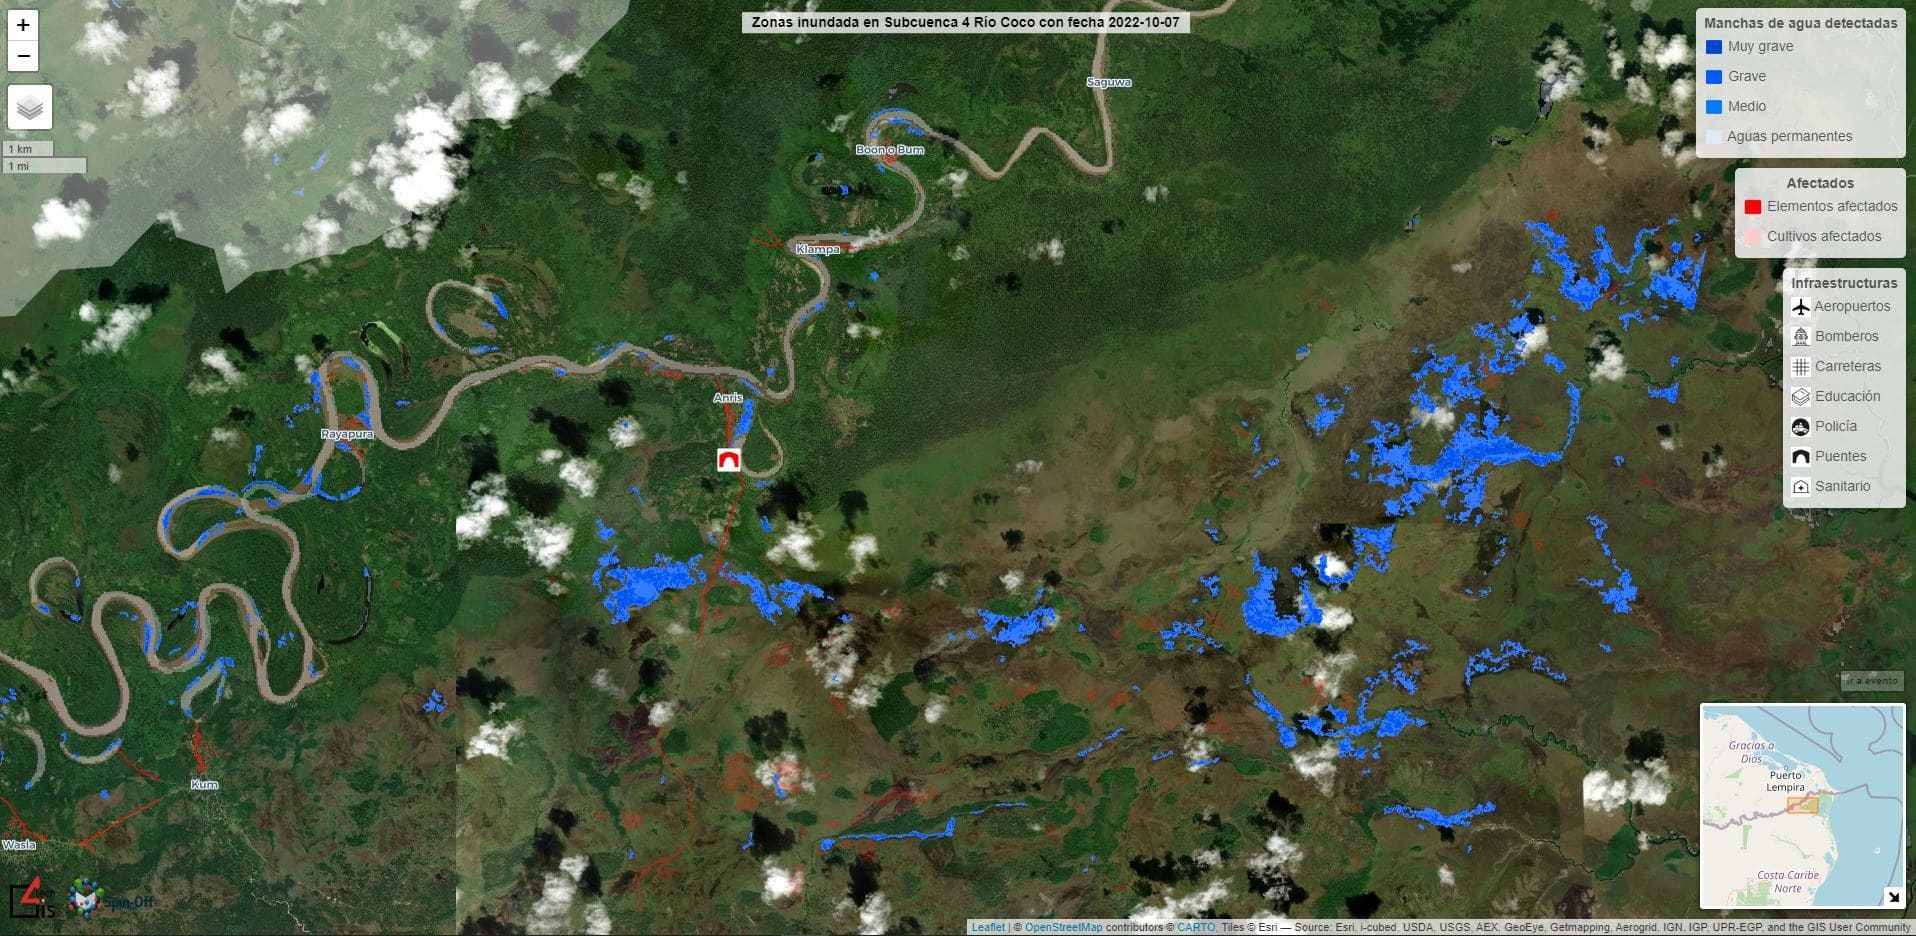
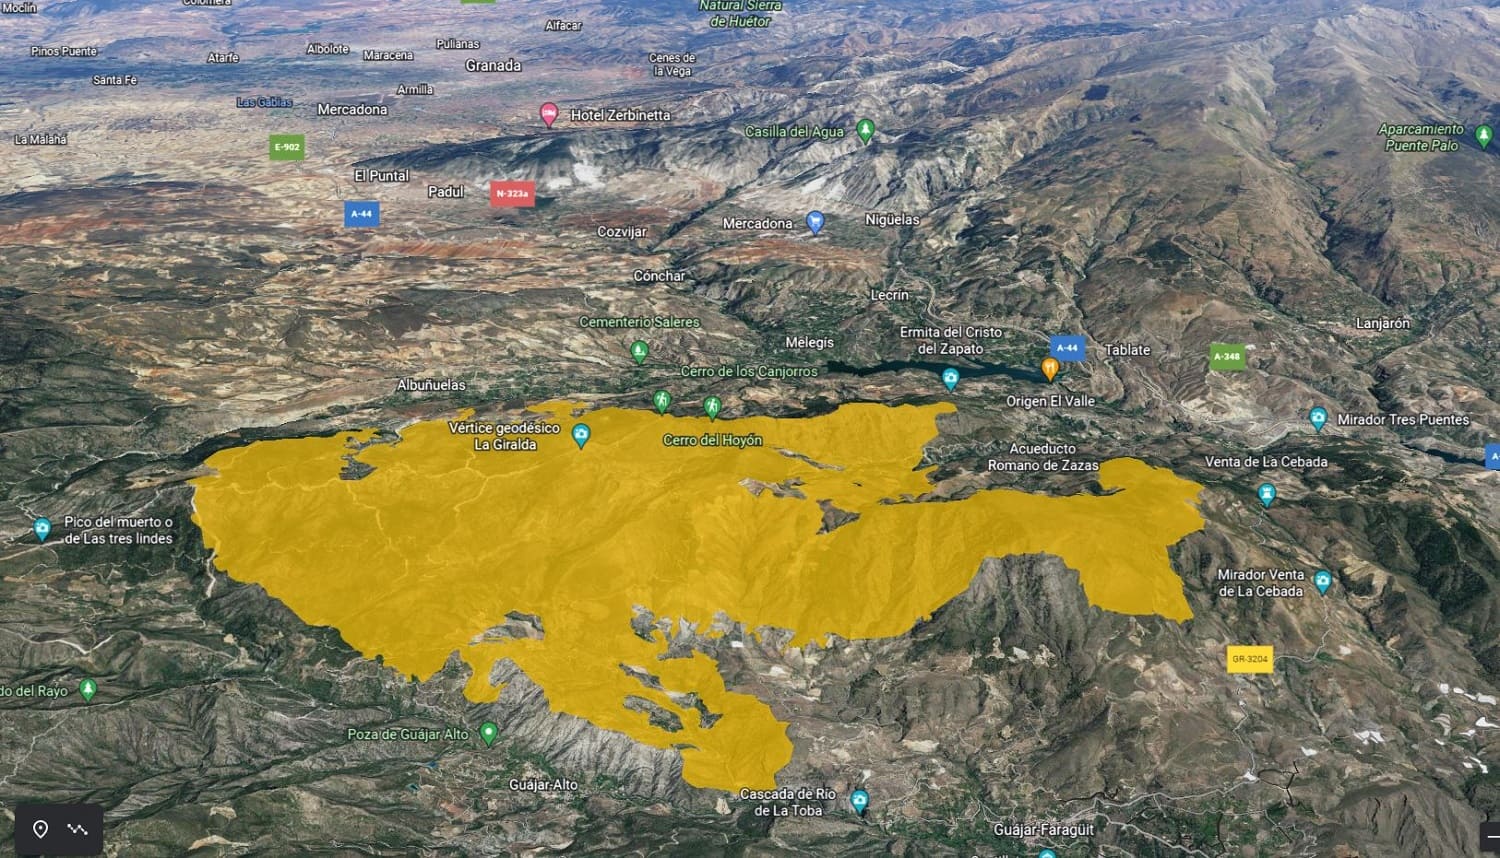
The flooded areas are cross-referenced with the different elements of the territory, such as housing, infrastructure (health services or schools) and crops. the impact can be accurately assessed.

5. Population, infrastructure and crops affected

The population affected by each event is obtained by cross-referencing with the most current population censuses and reference layers (hospitals, airports, roads, etc.) in each area. We can also determine where the crops affected by the flood are located.
Tabla para monitorear personas e infraestructuras p afectadas por eventos de inundaciones

How to interpret the map and its indexes?

The areas shown as flooded areas correspond to those with areas of standing water after flooding, according to satellite information. Therefore, the extent of the actual flooded spot is much greater than what can be displayed on the screen, and depends on factors such as slope and land uses.

On the other hand, also we can display the elements "Affected" and "On Alert". Red tones symbolize the affected elements of the territory (houses, crops, infrastructures...) and orange tones represent the elements on alert, close to the flooding event but which have not been affected.

The following image shows an example of the interactive map visualization:

Visor de inundaciones que muestra y monitorea el estado de personas e infraestructuras tras una inundación

How long does it take for alerts to appear?

Flood monitoring depends on the frequency of the satellite passages Sentinel 1. It is a constellation of two satellites orbiting at a distance of 180º, so the mission captures images of the entire Earth every five or six days.

This implies that, in areas where the satellite has passed just before the warning event, the delay will be greater (since it has to happen again after the event) and in areas where the satellite has passed just after the event, the delay will be shorter (since it will capture the event just after it has occurred). It is estimated that the delay with respect to the event will be between 1 day (minimum) and 4-5 days (maximum).

Comparte en:

Want to learn more about how to detect and monitor floods?

error: Content is protected !!