Analyzing surveys with Artificial Intelligence to aid decision making

We wanted to propose a method in which we analyze surveys with Artificial Intelligence to help decision making through a specific case study. For this purpose, we employ an Artificial Neural Network model consisting in the generation of Self-Organizing Maps (SOM) that characterizes profiles of individuals. Each profile generated will reflect whether there are differences in the perception that respondents have of the urban environment according to their socio-demographic characteristics, and may highlight the differences and help to take urban planning measures.

1. Conducting surveys and gathering information

The main objectives of our research were the following:
  • To know and identify children's contextual models or prototypes based on their personal and family context, place of residence and the way they relate to the urban environment.
  • To learn about children's perceptions of their school's urban environments.
  • To know the differences in the perception that children have according to the context.
Consequently, we obtained data from surveys of 459 boys and girls between 10 and 11 years of age in 21 schools in Granada on the following dimensionsWe adapted the form for better understanding by the children, which had 53 items, a map of the school environment where the child had to represent some variables, a space for the child to draw how he/she would like the route from home to school to be, and another space for the child to provide a sentence describing the route. We generated the statistics of the personal and family, residential, relationship with the environment and perception of the urban environment of the school of the complete sample.:
Tabla de variables recogidas tras el cuestionario de opinión a niños que refleja las opiniones de los niños sobre el contexto urbano en base a sus características sociodemográficas donde analizamos encuestas con Inteligencia Artificial para ayudar a la toma de decisiones

2. Data analysis and application of Artificial Intelligence

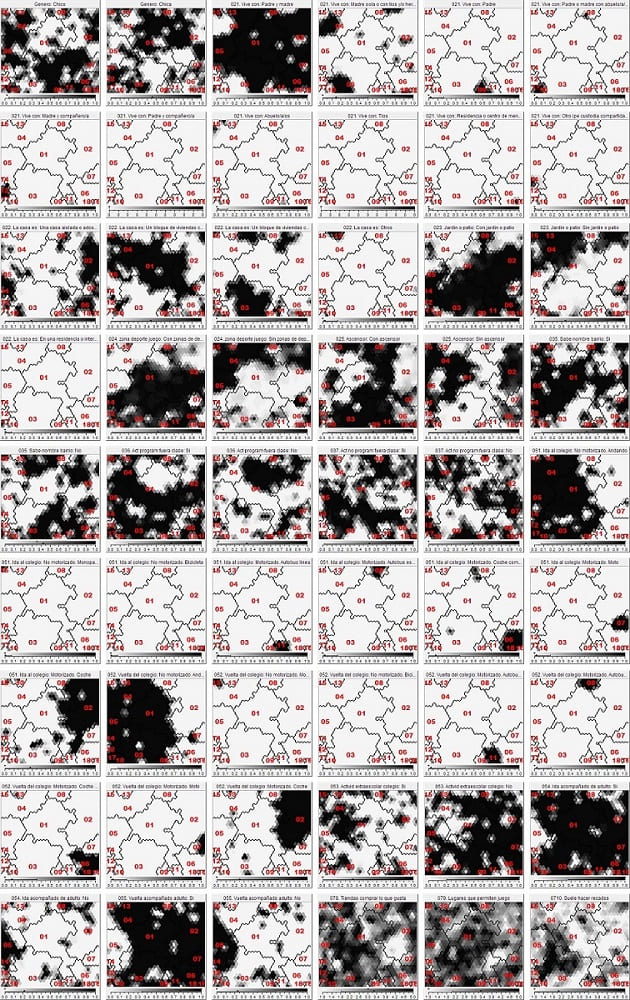
We carried out the SOM analysis previously performed using 40 of the personal and family, residential and relationship with the environment dimensions and the Odds Ratio (OR) analysis as a measure of effect size, generating an iterative process of determining the number of clusters in which 18 profiles were obtained, lo que permitió incorporar matices relevantes en la evaluación de la encuesta.

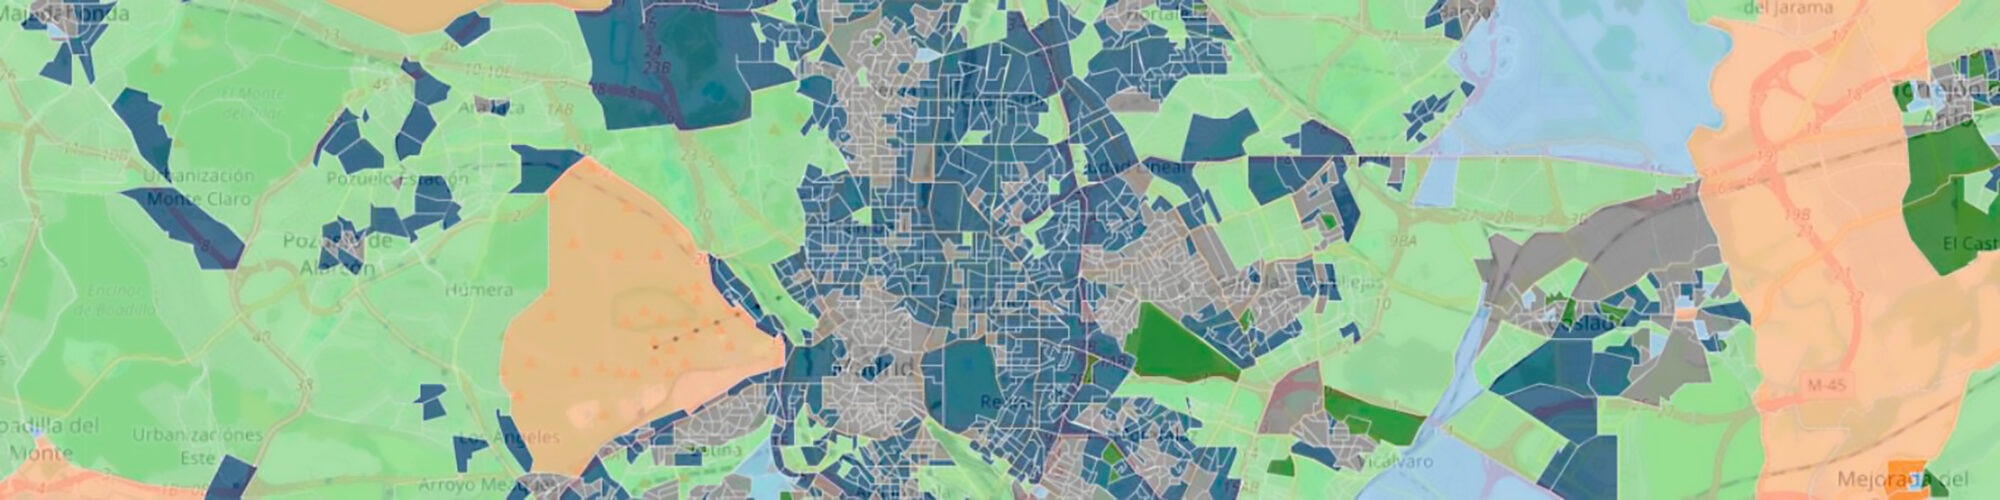
This generated a clustering in profiles visually represented in the following map:

Mapa autoorganizado SOM resultado del análisis iterativo de variables de la encuesta con Inteligencia Artificial en el que se generan los perfiles donde Tabla de variables recogidas tras el cuestionario de opinión a niños que refleja las opiniones de los niños sobre el contexto urbano en base a sus características sociodemográficas donde analizamos encuestas con Inteligencia Artificial para ayudar a la toma de decisiones

From this map we were in turn able to obtain the following heat map, which shows in a range of colors from green to red (from positive to negative effect) the effect of each variable and its explanatory capacity to belong to each profile based on its characteristics.

The map shows different groups of children with similar sociodemographic characteristics and opinions of the environment within each group and different between groups, which allows us to analyze and correlate the influence of sociodemographic characteristics with the perception of the environment:

Mapa autoorganizado SOM de calor en el que se muestran las variables que pertenecen o no a cada perfil en función del color

3. Results after the analysis of the surveys with Artificial Intelligence

Profile 1

Greater presence of girls in this profile living with both parents in a building with more than 5 floors.. High tendency to walk to and from school accompanied by an adult and to have a more positive perceptual evaluation.

Profile 2

Detached or semi-detached housing, commuting to school by car, on the way there and back. Low perceptual valuation, such as the number of parks, feeling of beautiful surroundings, stores where to buy what they like or places that allow play.

Profile 3

Children living with mother alone or with uncles, aunts, uncles and/or siblings in a block of more than 5 floors and moving on foot mostly. Positive perception in relation to autonomy, obstacles, stores OR places to play.

Profile 4

Frequency of male gender with a higher probability of living with the father and mother, who usually lives in an isolated home, performs activities outside of class, and walks to and from school unaccompanied by an adult. He is unhappy with his high level of autonomy. They value positively the parks, the obstacles, and do not express discomfort due to traffic..

Profile 5

Frequency of male gender with a higher probability of living with the father and mother, usually living in an isolated house, performing activities outside the classroom, and walking to and from school unaccompanied by an adult. They are not happy with their high autonomy. They value the parks, the obstacles, and do not express discomfort due to traffic..

Profile 6

They tend to live in a detached or semi-detached house, and commute by carpool. They enjoy less the people on the route, have less of a sense of beautiful surroundings and less appreciation of the stores. Negative evaluation of playgrounds, number of parks, cleanliness of streets, or assessment of the environment..

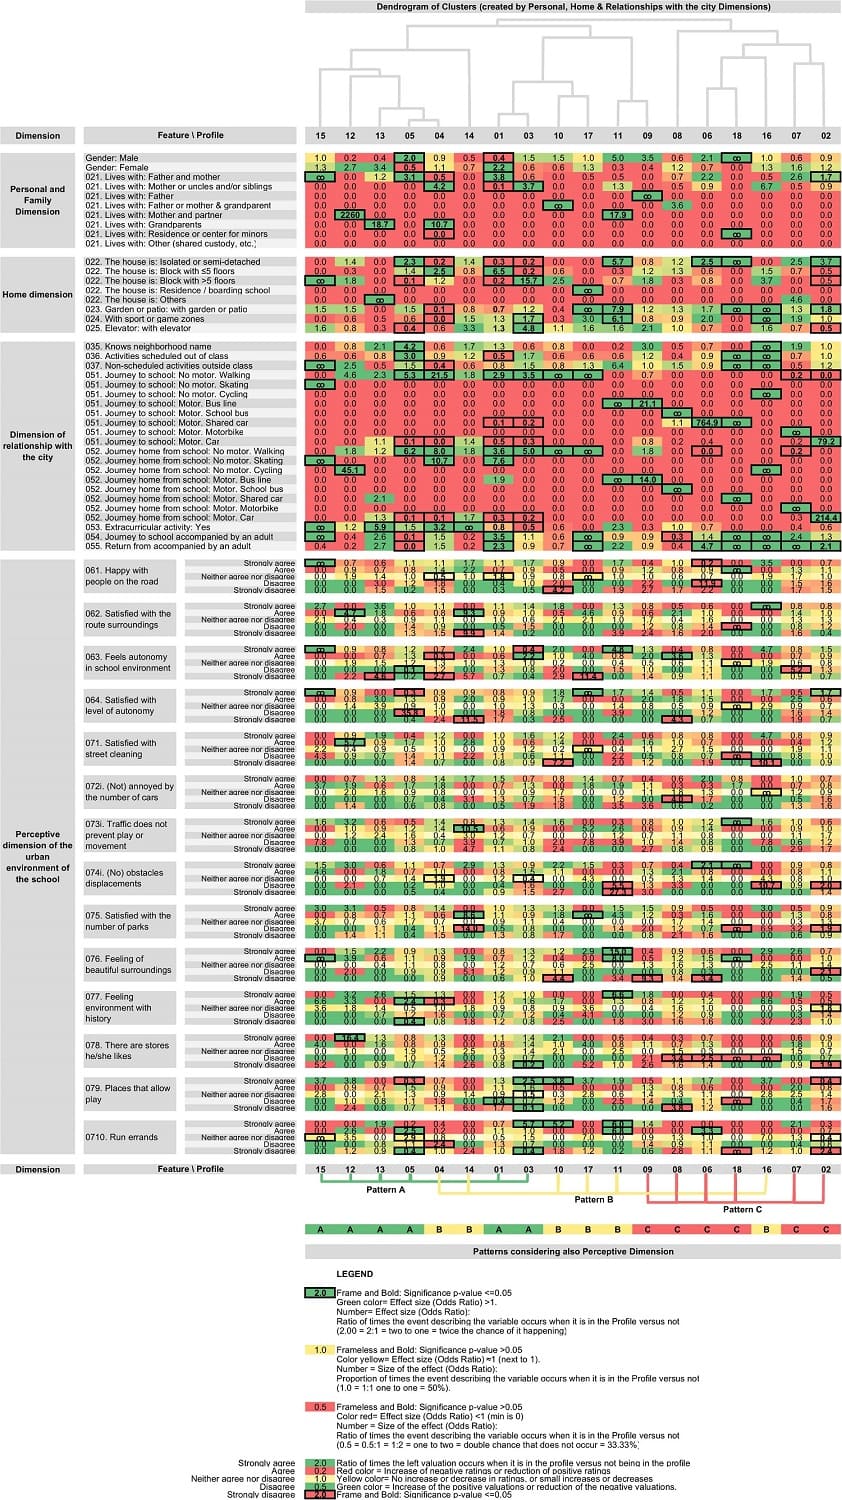
In other minority profiles there are other modes of displacement: in the profile 7 utilizan la moto y valoran negativamente la autonomía, en el profile 8 use the school bus, and positively value the number of cars, obstacles in the city, number of parks, the history of the city and places for play, presenting a high level of autonomy, although negatively valued.

On the other hand, the Profile 9 The child is usually: a child who travels by bus, appreciating his autonomy, not enjoying the people or the environment of the route, annoyed by the traffic, not appreciating that it is a beautiful environment, nor appreciating the stores.

As a result of this profiling, three basic behavioral patterns have been determined and characterized that link the contextual dimensions (personal and family, residential and relationship with the urban environment), with the dimension of the child's perception of the urban environment around his or her school:

Pattern A

Predominance of a significantly more positive perception of the child's perception of the reality of the school environment. Coincides with the most frequent family organizations and in which the child travels mainly on foot. With this pattern we can find Profiles 1, 3, 5, 12, 13, and 15.

Pattern B

Intermediate perceptual assessment. Certain uniqueness in its family structure. We can find: a) Profile 4, the child lives only with his mother; b) Profile 10, the child lives with his father, mother, or grandparents; c) Profile 11, residing with his mother and companions or with his grandparents; and d) minority profiles, such as Profile 14, with children living in juvenile centers; Profile 16, who usually travel by bicycle; or Profile 17, residing in a boarding school.

Pattern C

Inferior perceptual assessment of reality in a number of variables. In this pattern the child usually moves with motorized means.

After that, we were able to conclude that there is a relationship between children's modes of travel, family structure and the degree of autonomy they enjoy in relation to their perception of the urban environment near their schools. This may give clues about the effect on children's perception of the city of the reduction of motorized traffic and the actions that should be taken on territorial and urban planning, oriented to walkability, pedestrian and sustainability

This study in which we analyze surveys with Artificial Intelligence to help decision making is very useful for many of our projects, especially for those in the humanitarian field.

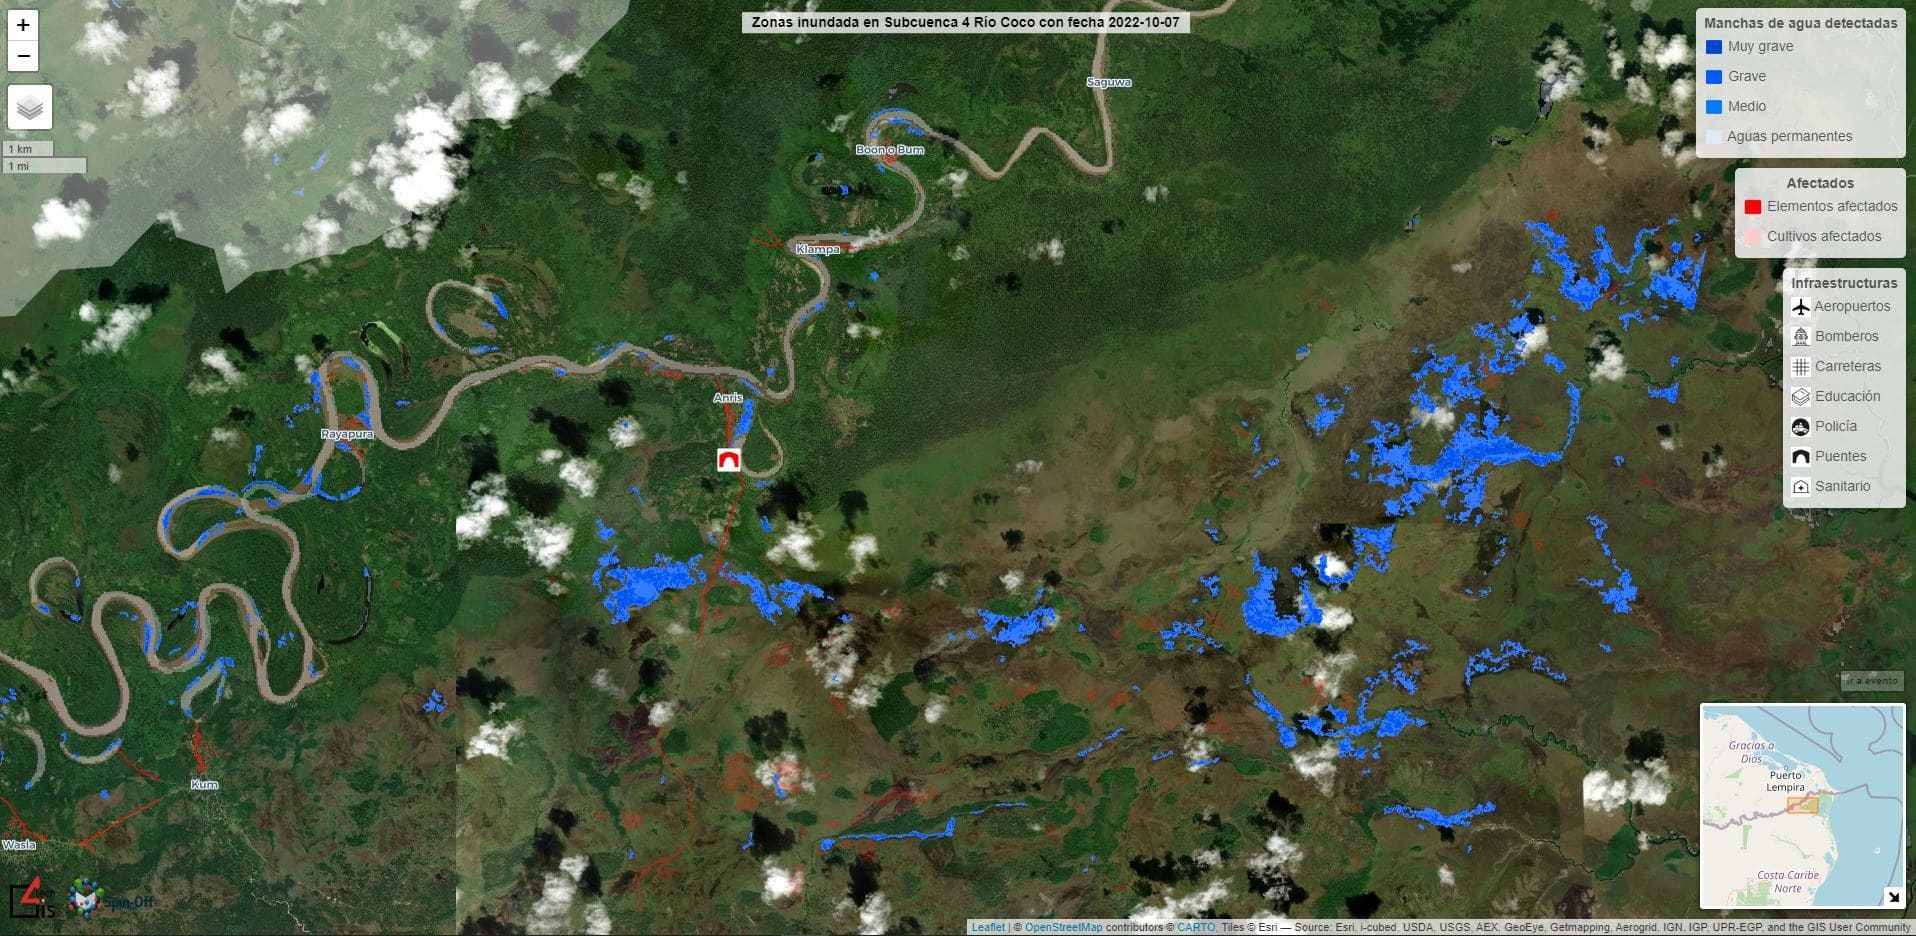
This is because the methodology studied allows for the differentiation and grouping of people according to their degree of vulnerability and the need and urgency of intervention by humanitarian actors in developing countries such as Honduras, Nicaragua, Guatemala or Venezuela, which frequently suffer food crises due to natural disasters such as hurricanes, earthquakes or volcanic eruptions.

Comparte en:

Would you like to know more about how we analyze surveys with Artificial Intelligence?

error: Content is protected !!