Urban context and area of residence can highly influence the social disadvantage of groups of citizens., lo que podría mejorar mediante la renovación o adaptación de los entornos que propician esta desventaja. Es por ello que realizamos un análisis de patrones basado en Inteligencia Artificial, de cara a anticipar este hecho mediante la detección de realidades “similares”, lo que puede anticipar que estos fenómenos ocurran en otras zonas en un futuro, así como This is why we performed a pattern analysis based on Artificial Intelligence, in order to anticipate this fact by detecting "similar" realities, which may anticipate that these phenomena will occur in other areas in the future, as well as.
In order to carry out this study, neighborhoods in different parts of Andalusia were sampled and the following steps were followed:
We obtained data from the Population Census of Andalusia through the Institute of Statistics and Cartography of the Junta de Andalucía. Preparamos los datos mediante su integración, limpieza y transformación para sintetizar las principales cualidades demográficas necesarias para el estudio.
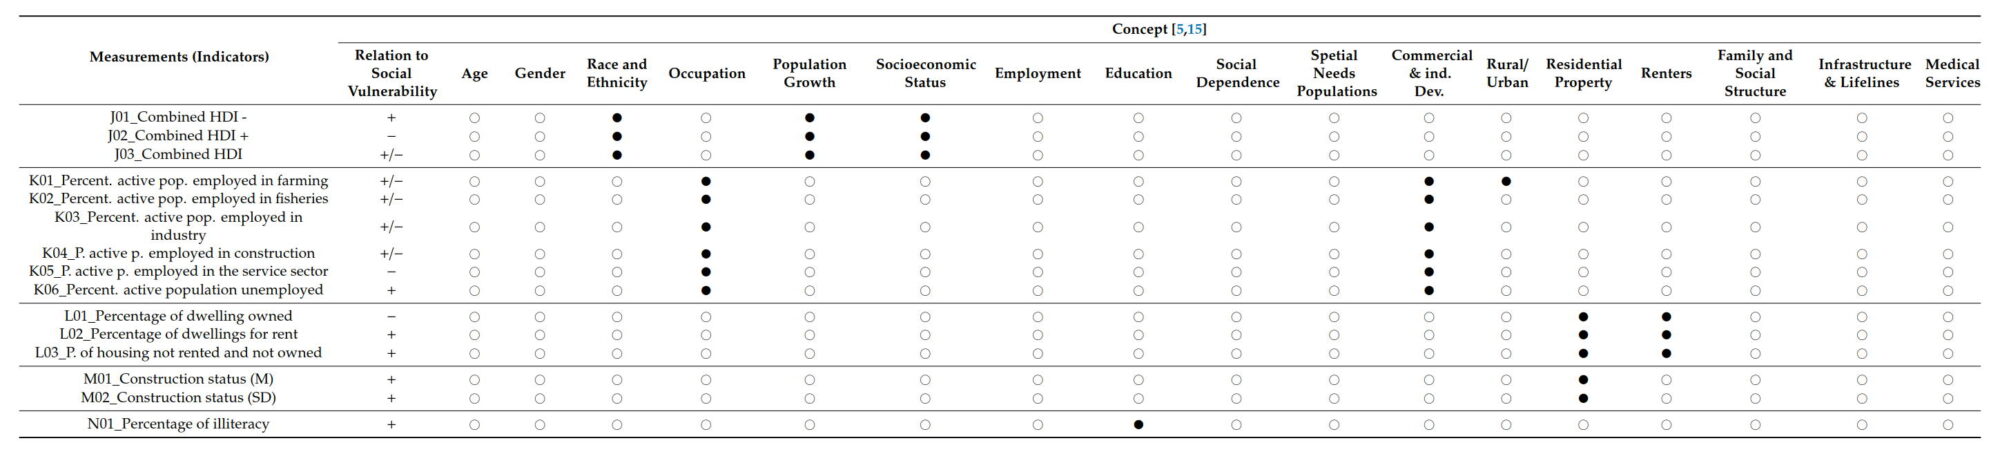
A partir de dicho censo we developed indicators to measure and identify which factors of social vulnerability are related to social vulnerability (gender, ethnicity, occupation, education, area of residence or nearby infrastructure).
Two databases were unified, one with demographic and social data and the other with housing data. The data from both databases were modeled in different phases to generate social vulnerability profiles and create decision trees.
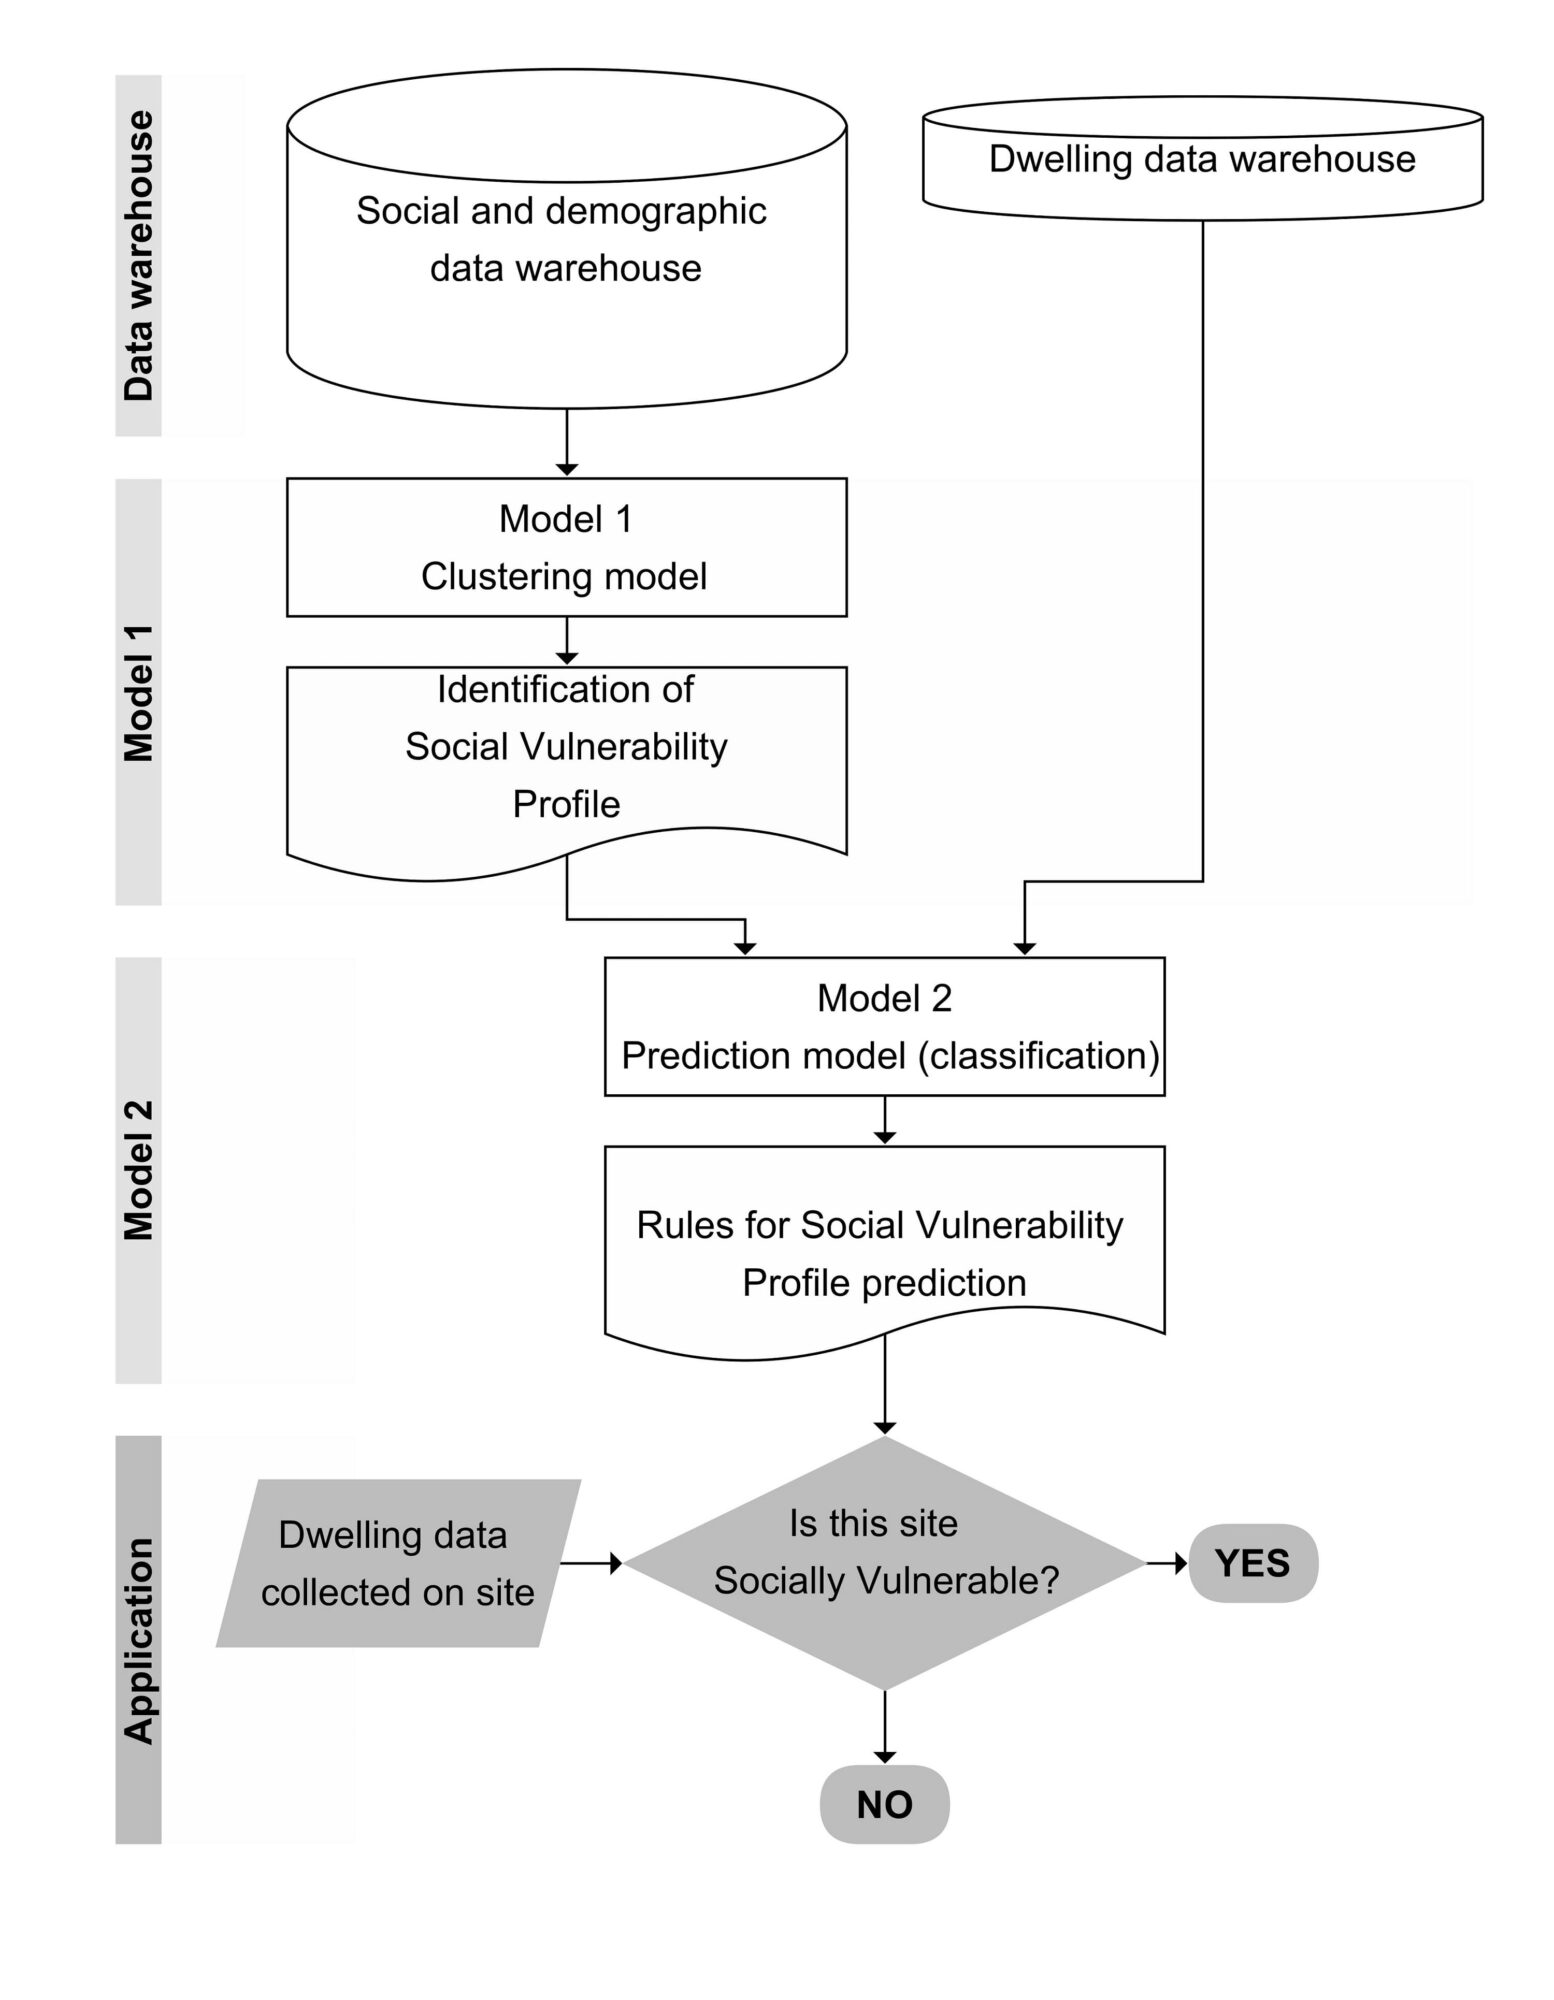
We group and label data from the demographic and social dimension by means of an Artificial Neural Network in the form of a Self-Organizing Map (SOM) that allows grouping the data and simplifying them based on a pattern, generating profiles of individuals. De cara a seleccionar el número óptimo de perfiles llevamos a cabo un proceso iterativo que va generando perfiles y se detiene cuando la explicabilidad del nuevo perfil es insuficiente y su fragmentación presenta poco valor práctico y conceptual.
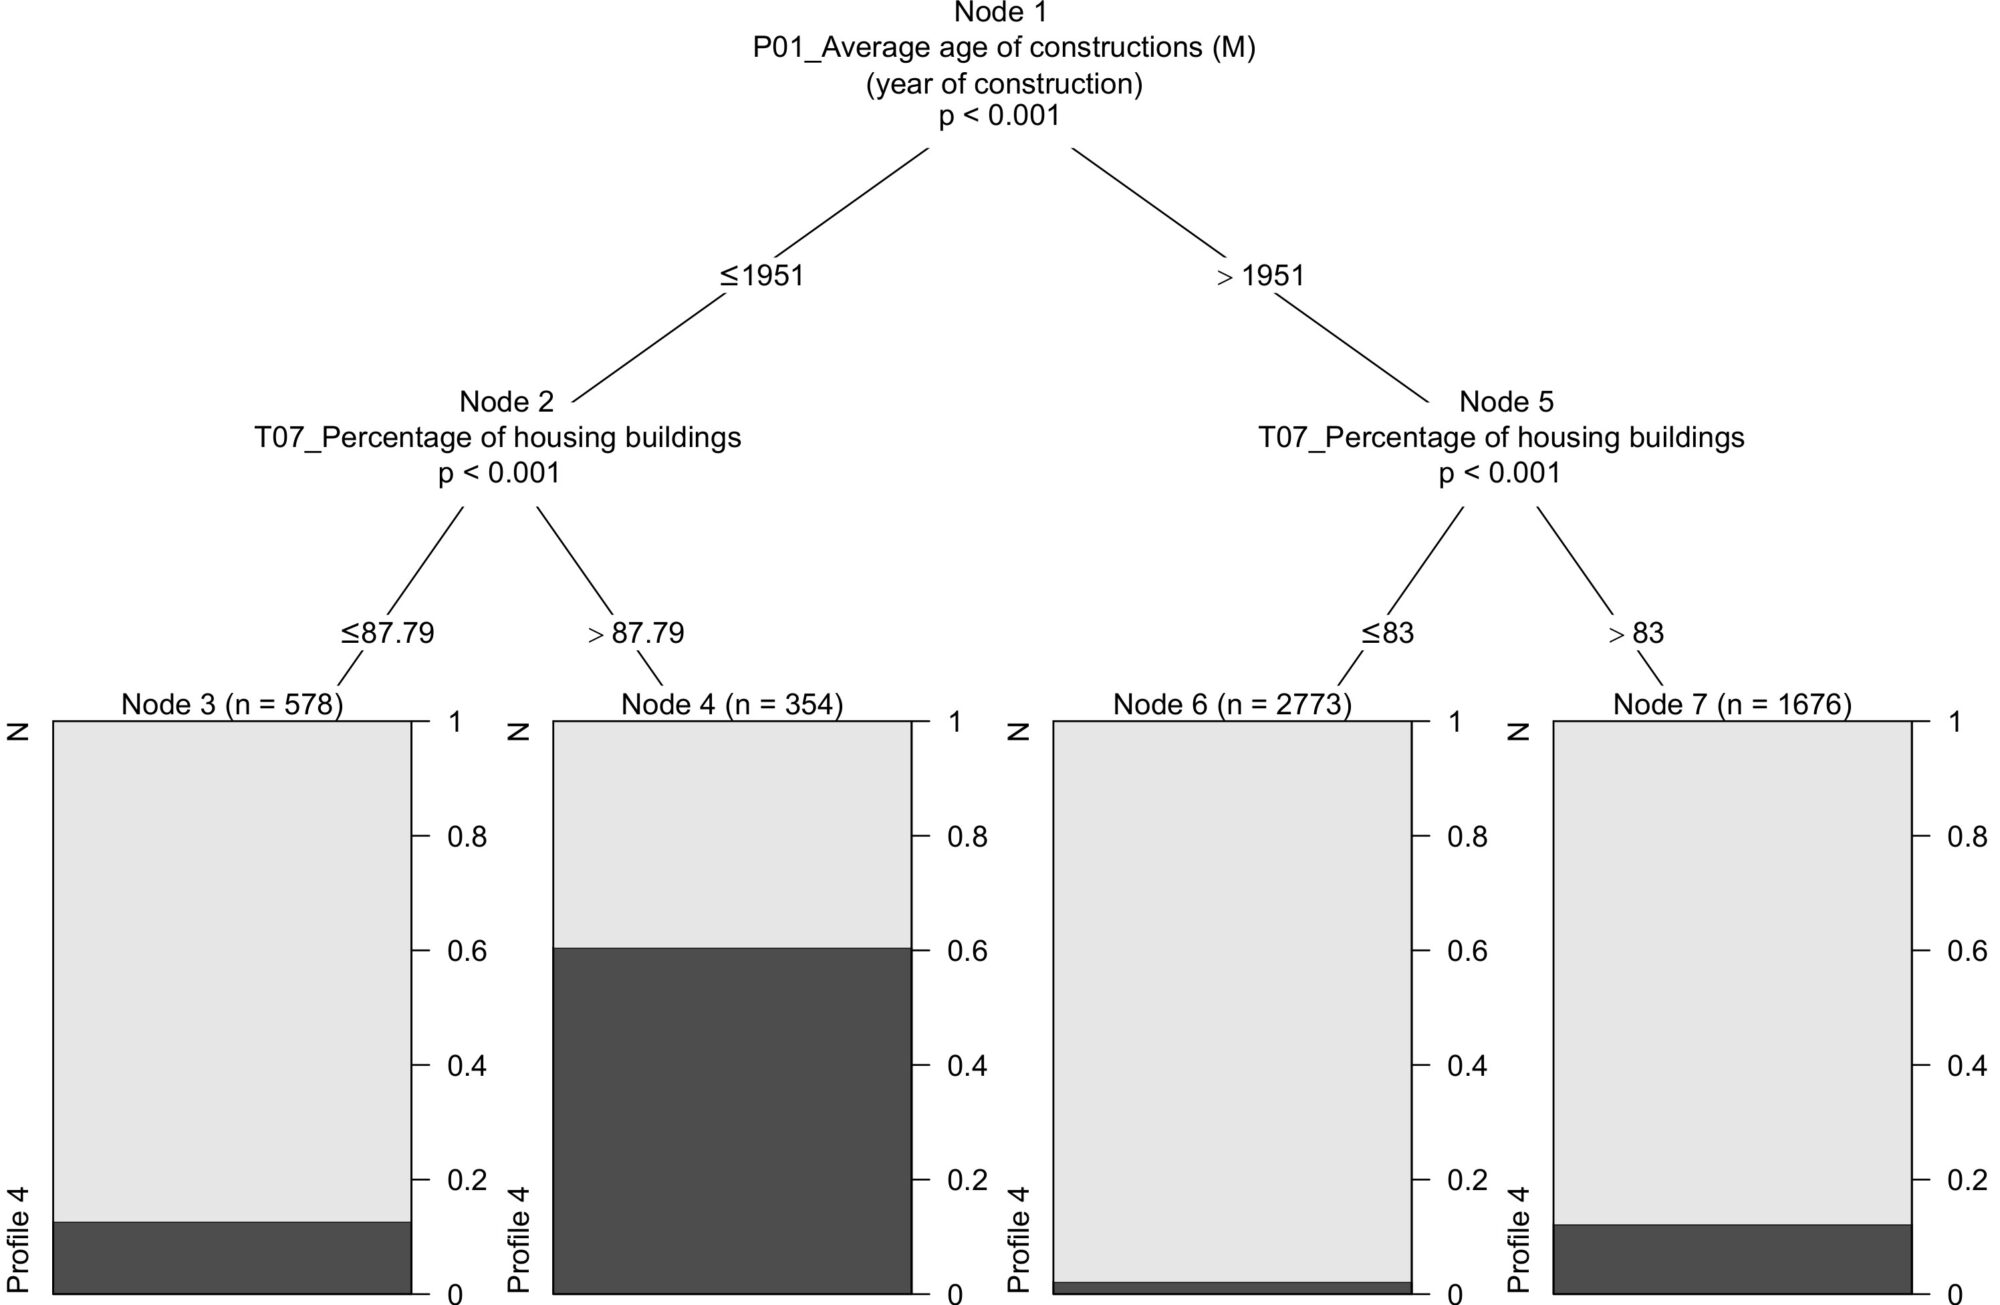
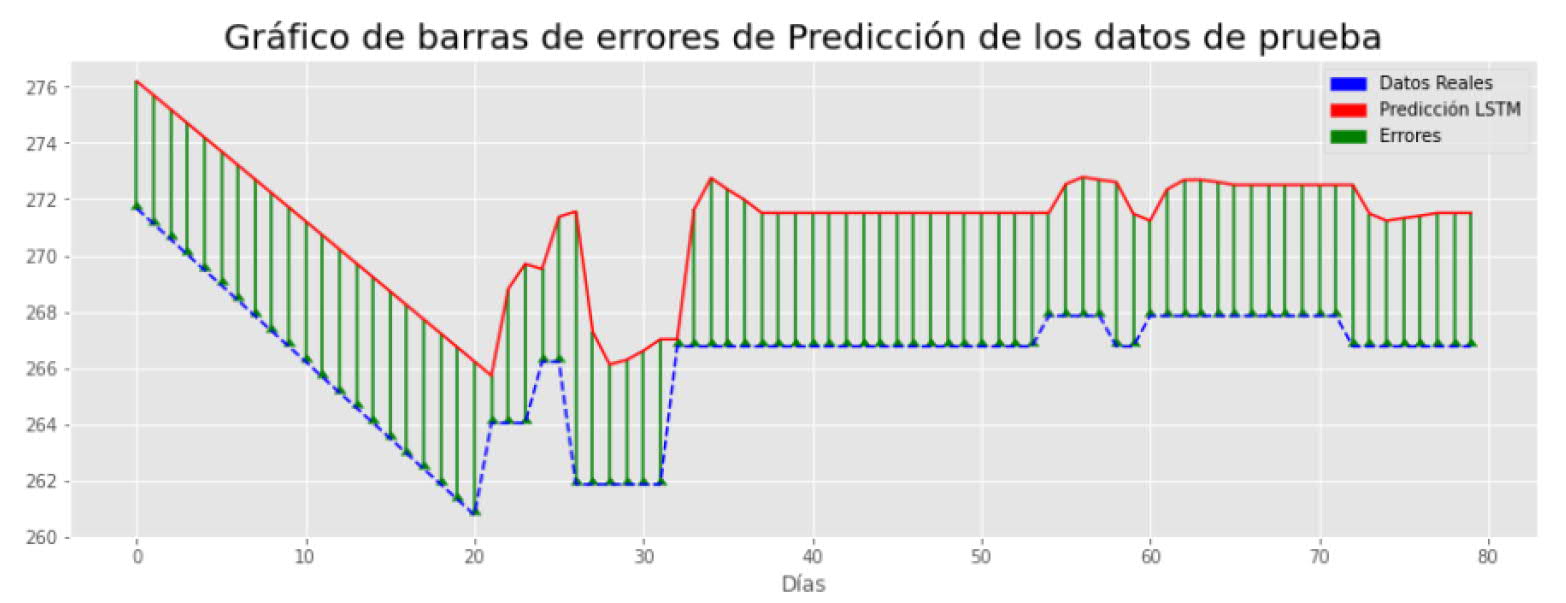
In order to predict social vulnerability, we created a decision tree, identifying the degree of probability of the existence of the vulnerability pattern obtained in phase 1.
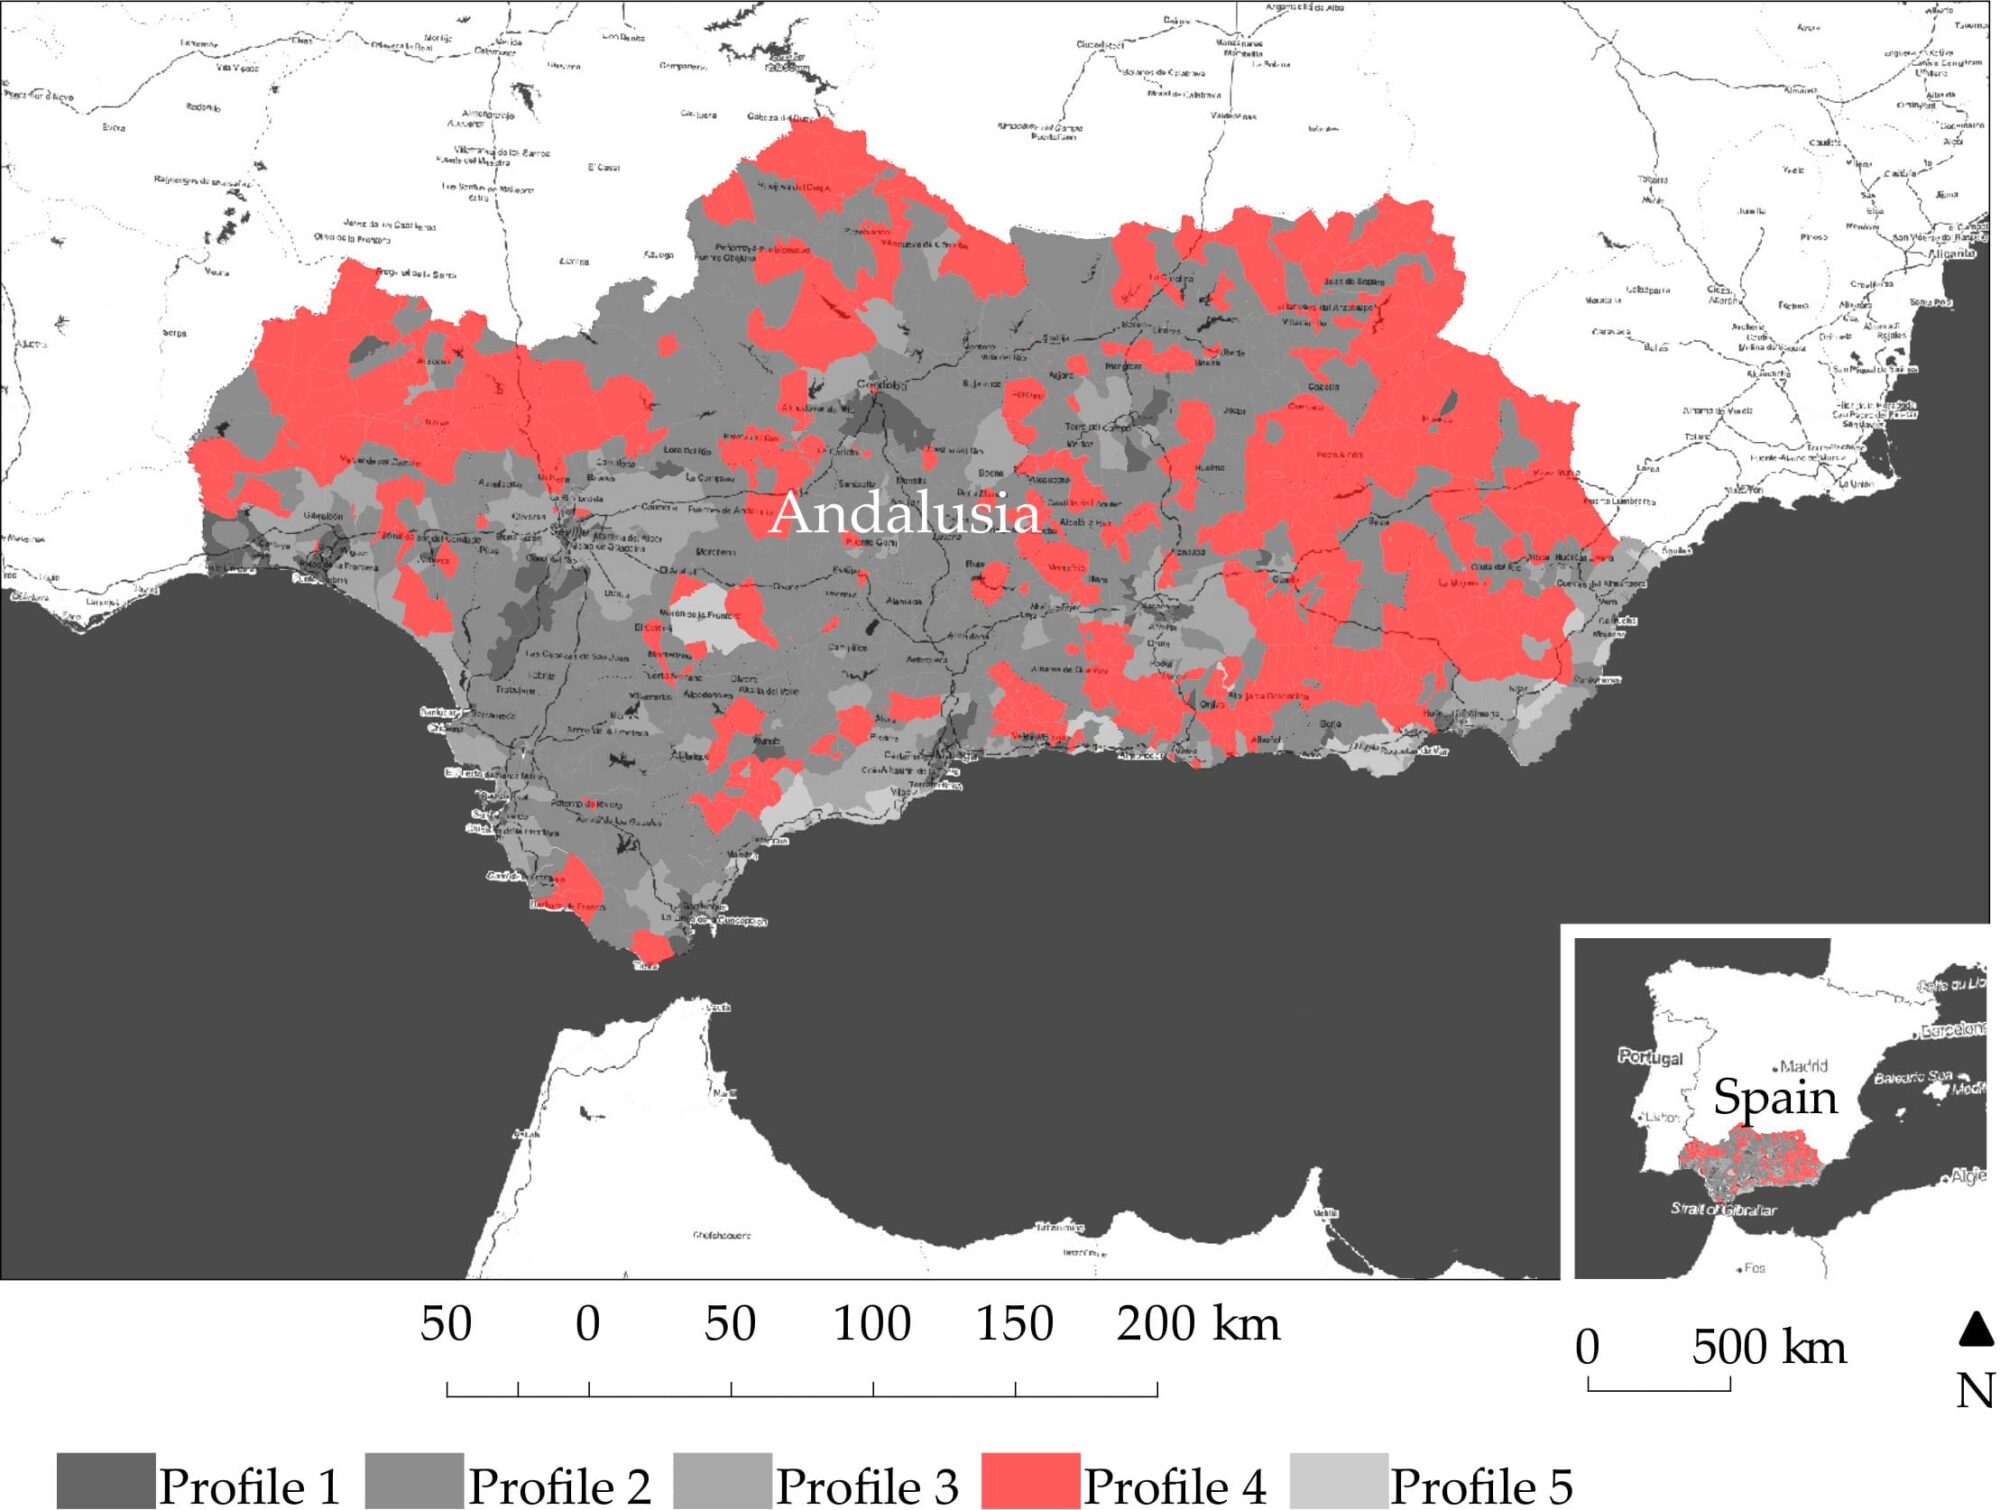
Greater presence of delinquency, greater number of people per building, greater dedication to service employment and a lower number of dwellings per occupied household. Population located in urban environments.
Diversification of employment with little presence of the service sector, an eminently Spanish population, few immigrants and a high number of illiterate people, with little presence of single-adult households and children. Population located in rural environments.
More births and immigrants of provincial and, to a lesser extent, regional or national origin. They work in the province, high percentage of employed and low unemployment rate. Lower than average age, few single-person households and low level of rootedness. Located on the outskirts of the main cities.
High average age, many single-occupant households, many empty homes and with problems such as lack of running water in greater proportion than the rest. They live in settlements with good ratios of cultural facilities and welfare per population, derived from the low number of inhabitants of these populations and an acceptable distribution of these functions. Isolated rural locations and at a greater distance from the main cities.
High number of houses occupied by a single person, often with a minor in charge, high presence of immigrants from the rest of Andalusia, Spain and foreigners. High employment rate, low unemployment and low inactivity, working in the service sector or agriculture. Urban areas with presence of foreign residents. Tourist enclaves or intensive agricultural production.
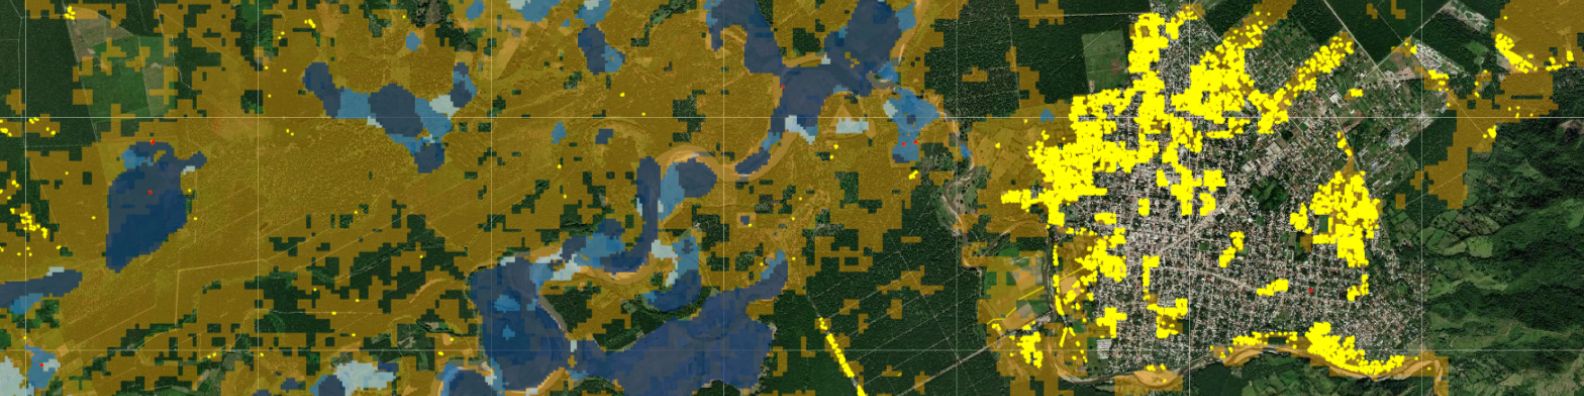
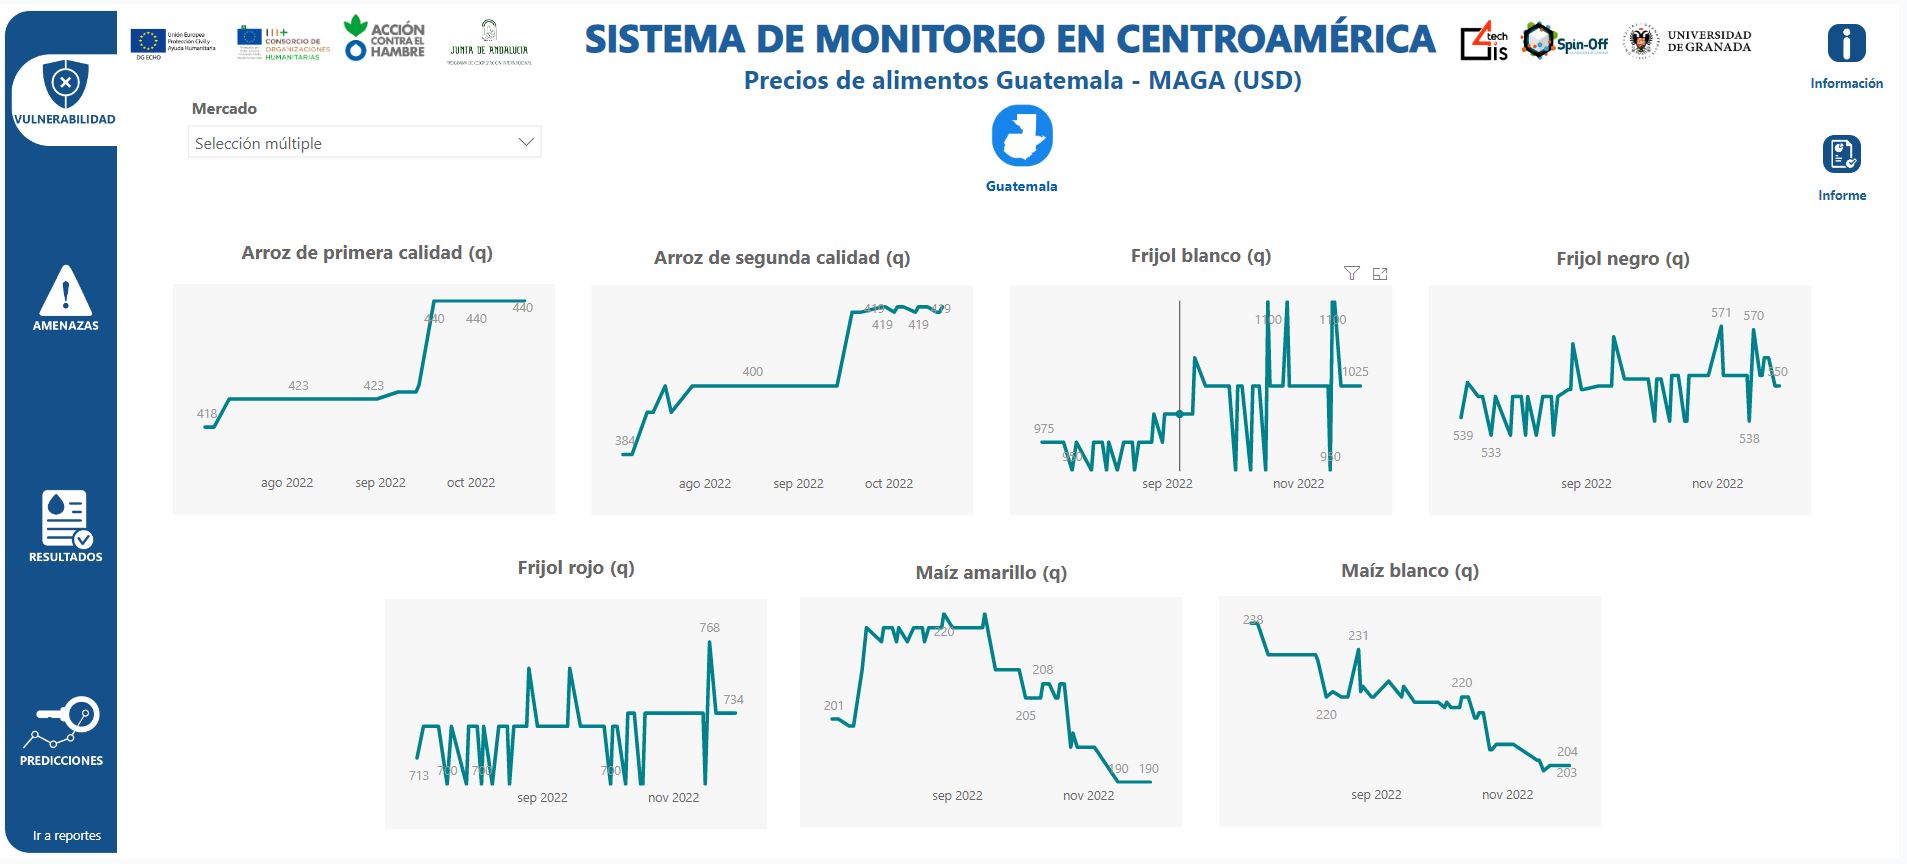
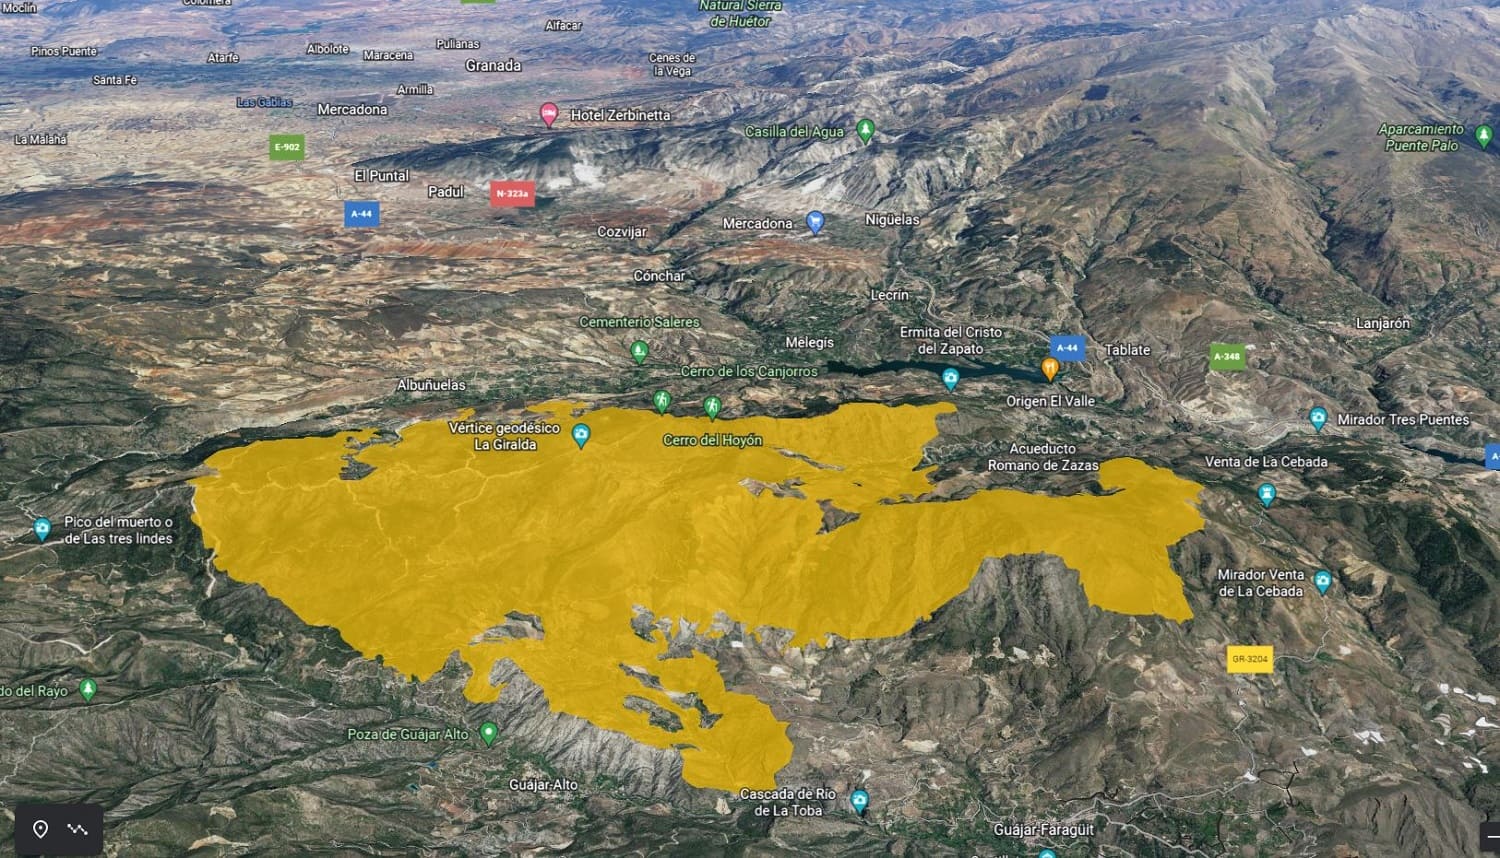
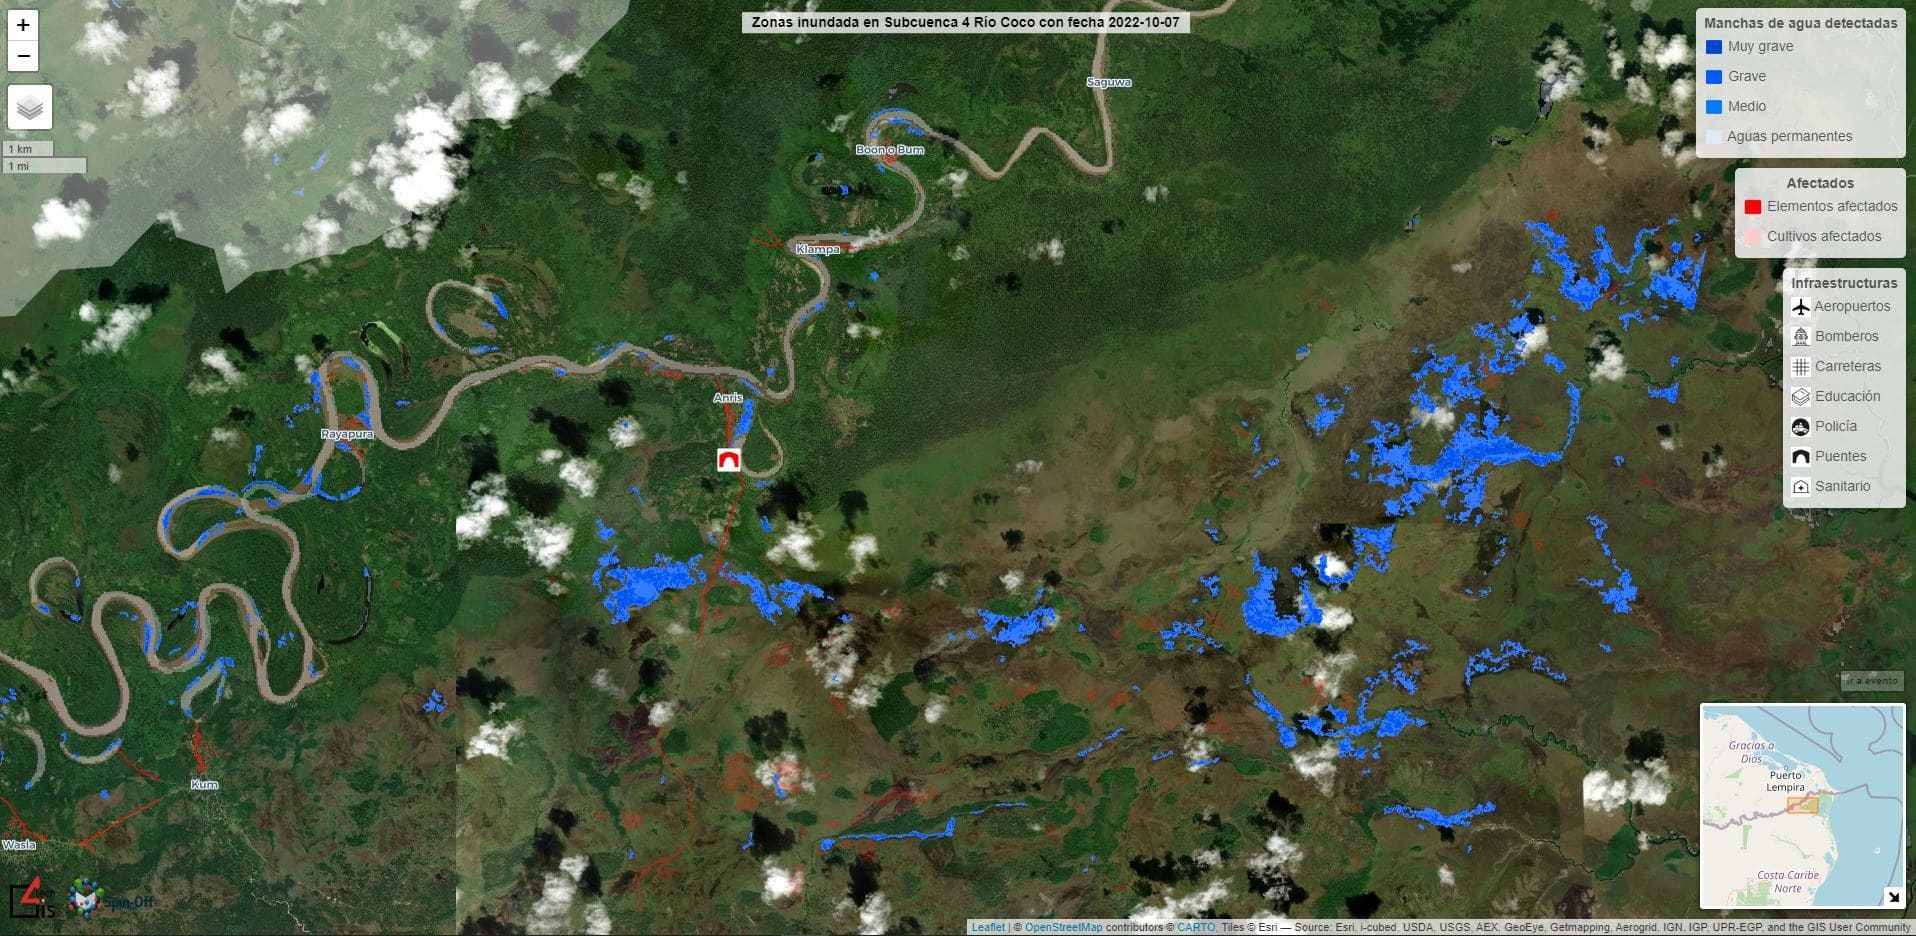
This research has served as the basis for similar research for estimating the social vulnerability in Central American countries, whose social and economic situation is influenced by the residential environment and geographic location (with greater or lesser impact of meteorological phenomena such as hurricane flooding, terremotos o volcano eruptions).

Correo electrónico: info@gis4tech.com